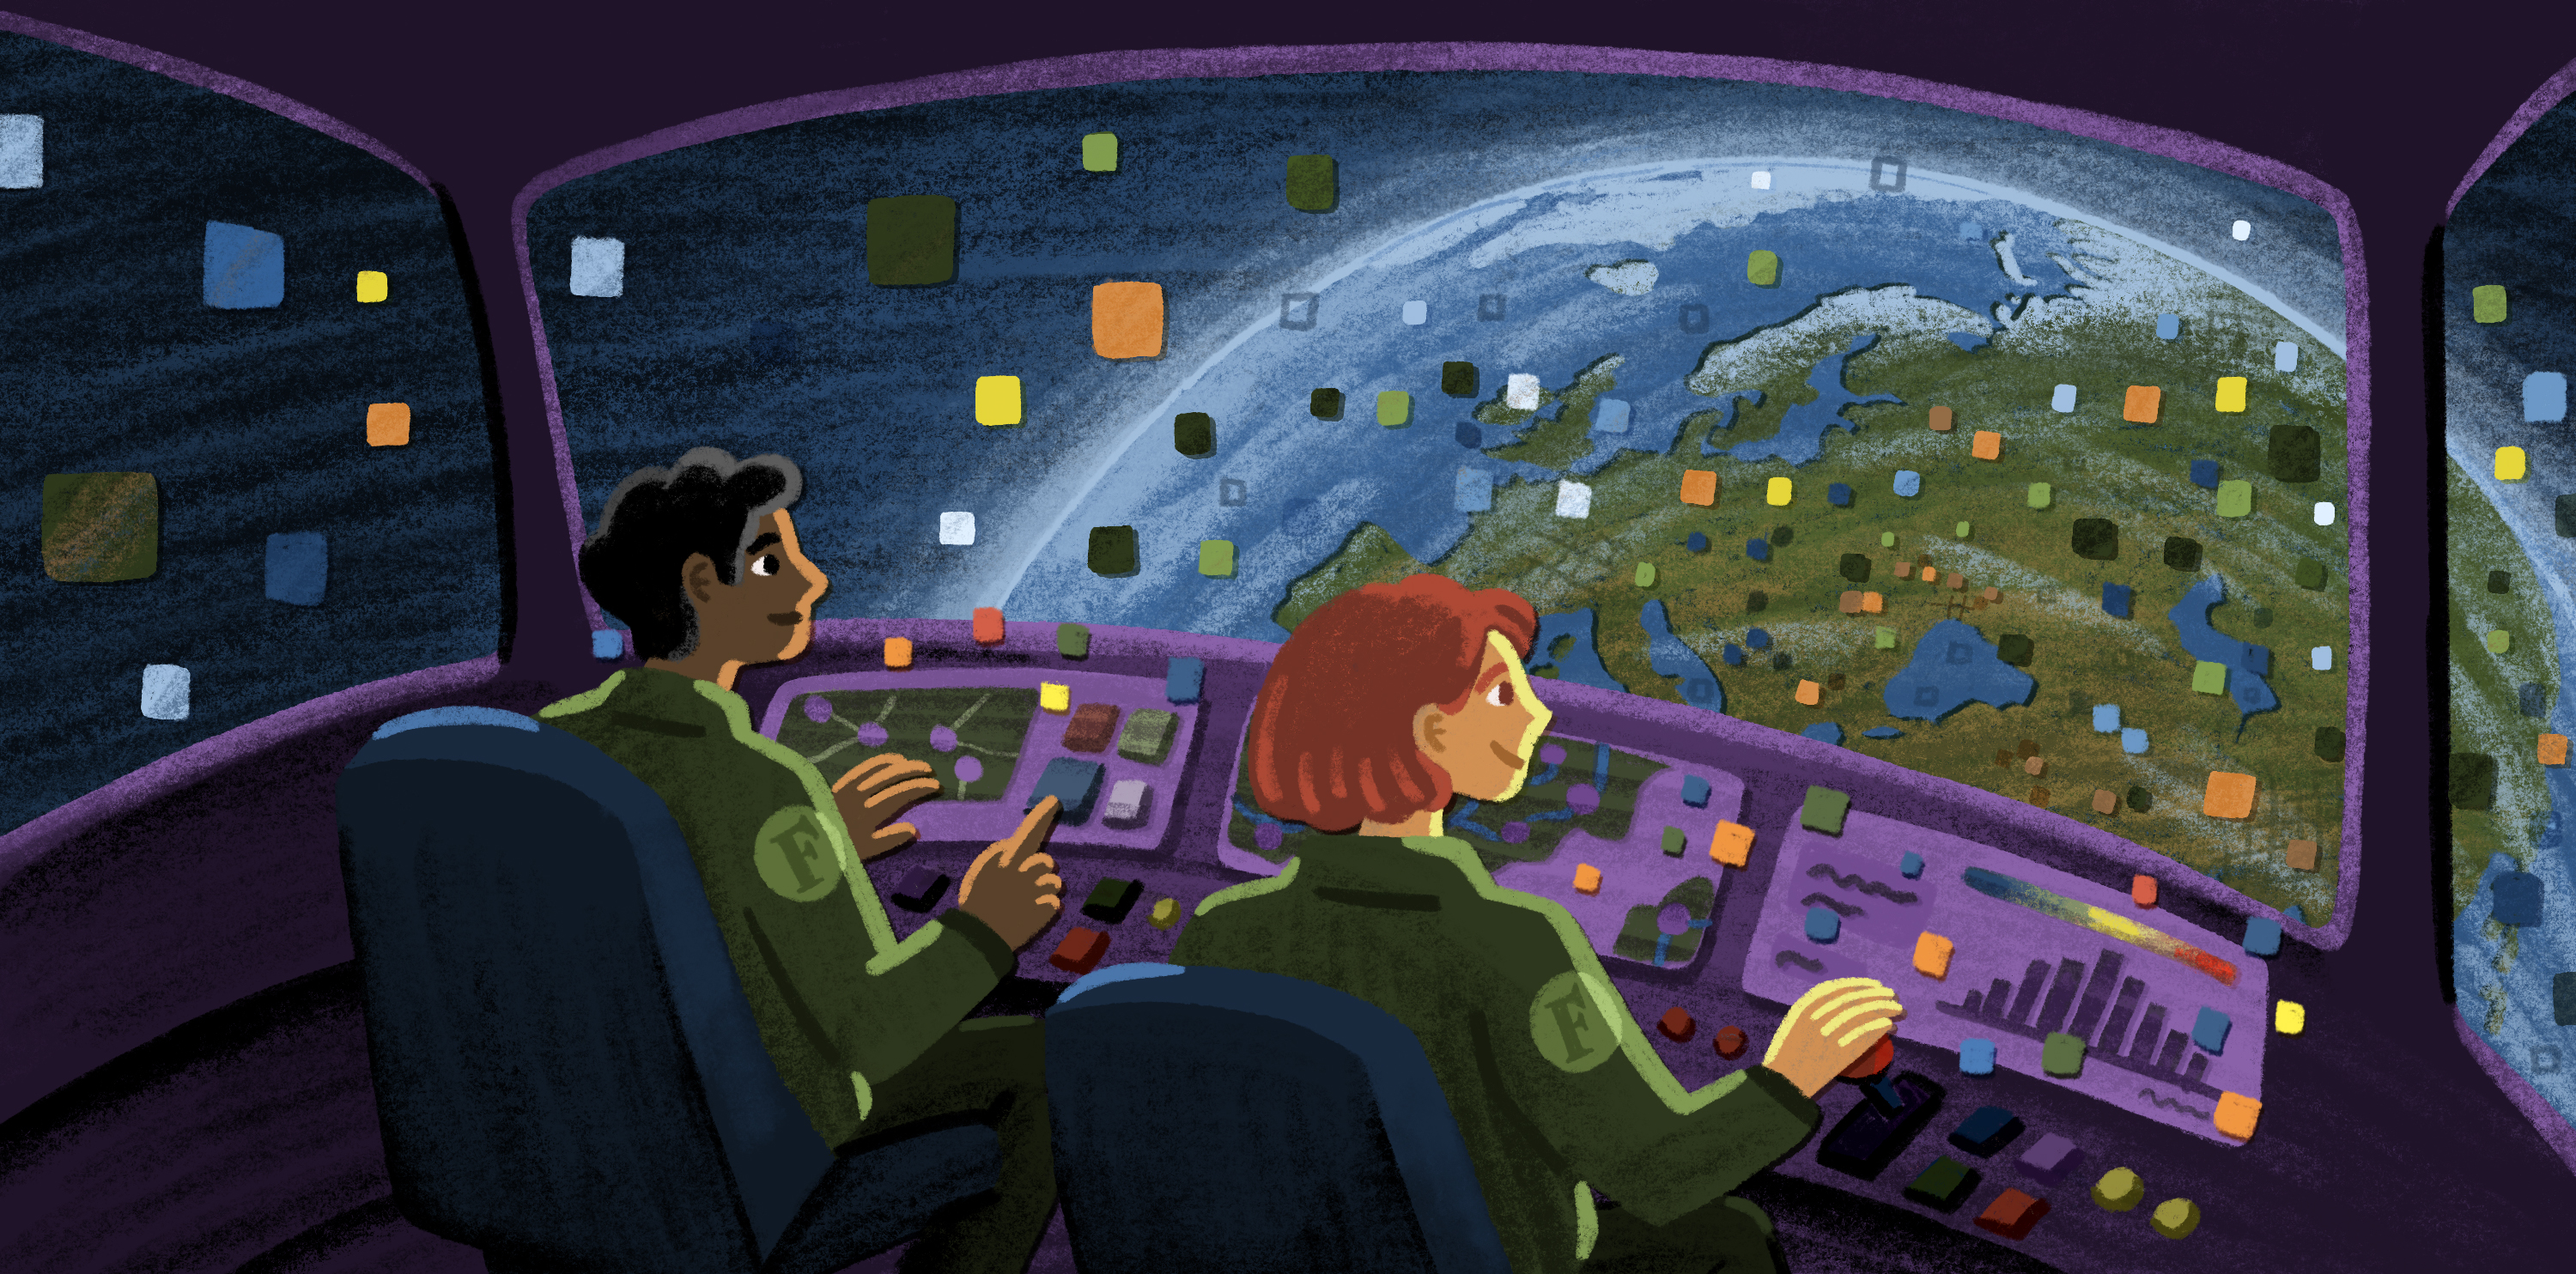
Raster data is fundamental to spatial analysis. Its pixels hold answers about drought, depth, elevation, and more. But getting those answers has never been just about knowing your data. You also had to know how to stand up a stack that can handle the files, then bolt on tooling to run statistics, filter pixels, or build elevation profiles. Raster work ends up second-class: built outside your core workflows, clunky, and cut off from the decisions it should inform.
Not anymore.
Felt has long served analysts working in agriculture, urban planning, insurance, and environmental science by making it easy to visualize rasters in a fast, collaborative, GIS platform. Today we're taking a big step forward adding core raster analysis workflows, all callable through Felt's AI Assistant and MCP.
With this release you can now:
- Run zonal statistics: calculate summary statistics from raster dataset cell values that fall within user-defined regions or "zones”
- Analyze raster bands: process and evaluate individual layers of pixel values in a digital image or spatial grid to extract geographic, environmental, or spectral information
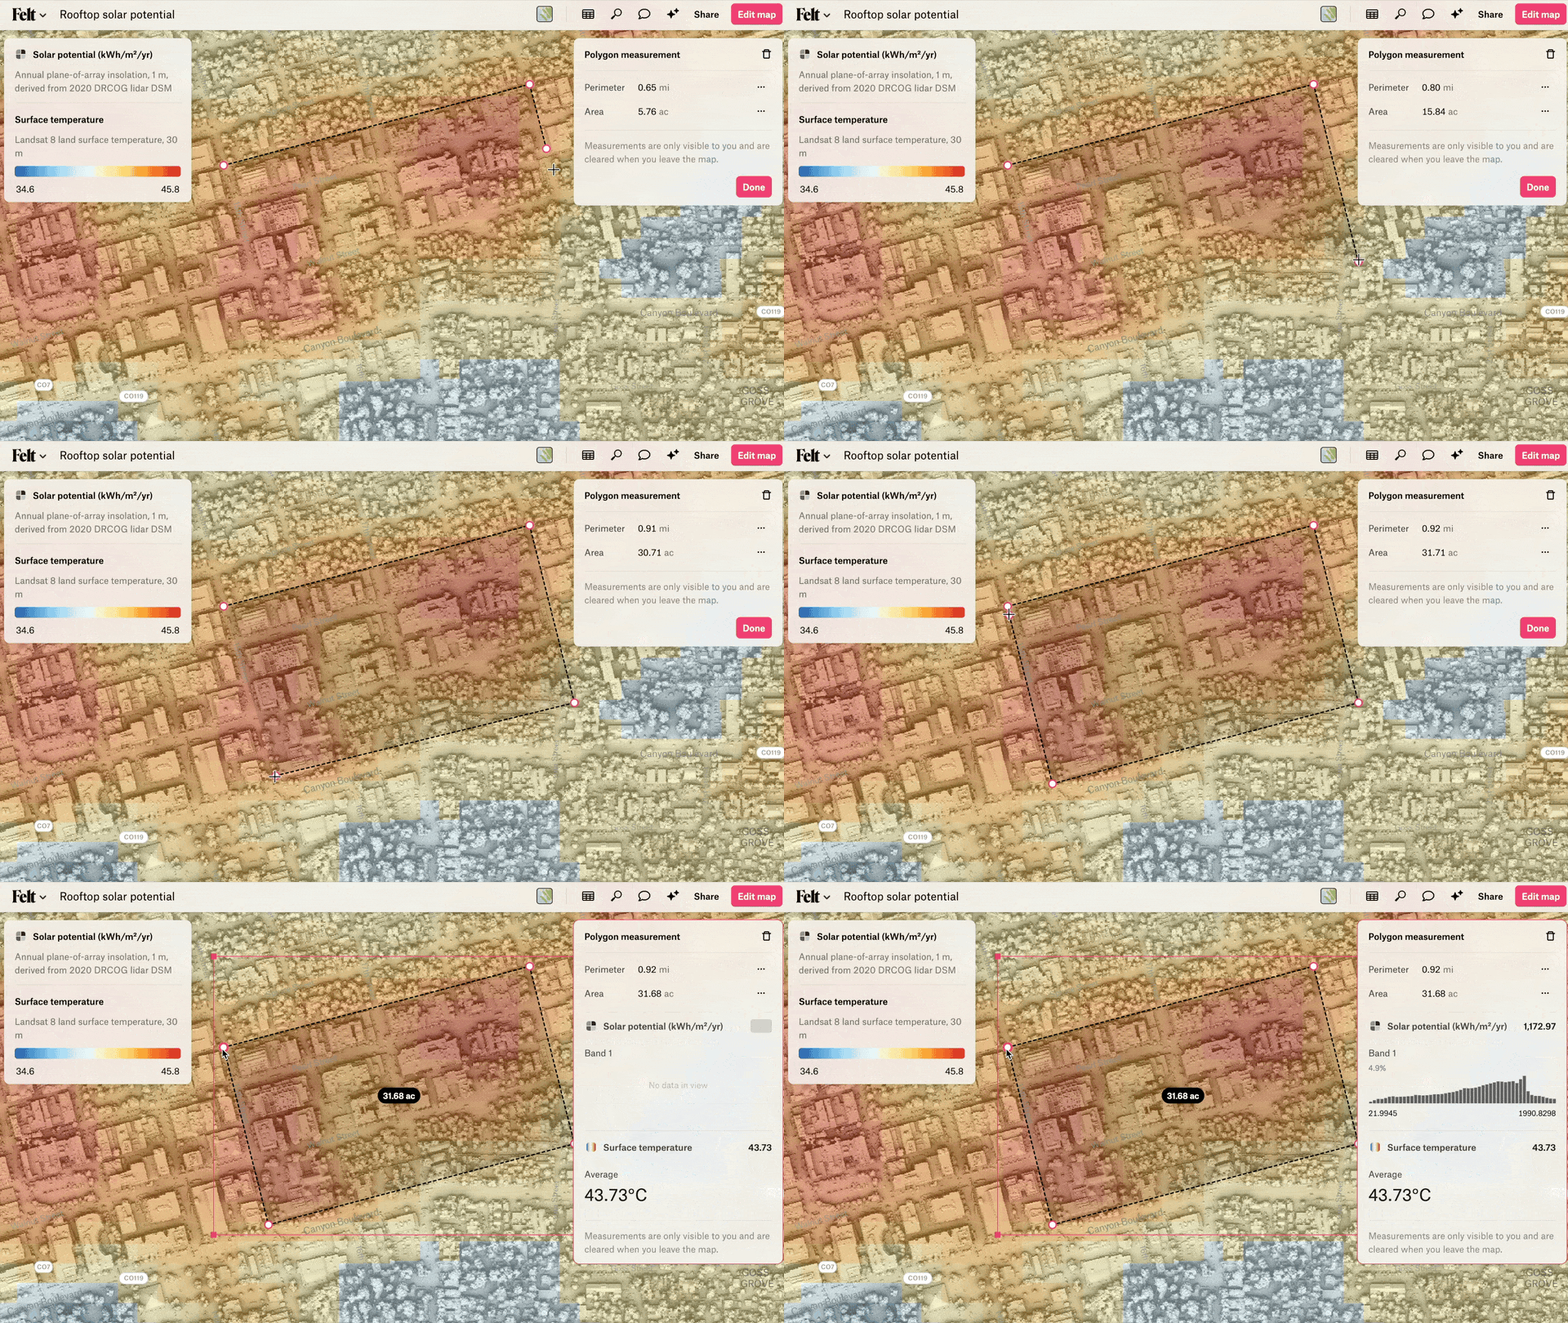
- Set a spatial filter: outline a site or a district and every raster on the map is clipped to it, each reporting a headline number for that area
- Profile elevation data: create a two-dimensional cross-sectional graph that shows how elevation changes along a specific line or path across a raster grid
- Enrich vector data with raster values: extract information from a raster surface and add it as new attribute data to discrete points, lines, or polygons
Raster is faster with Felt AI
Running analysis in Felt doesn’t just bring all your workflows into one place, accessible to the whole team – it accelerates the output as well. From sourcing the data to determining what type of analysis to run, Felt’s AI is fully equipped to call and apply raster analysis tools as applicable.
For example, a renewable energy developer wants to explore locations for expansion – they need to understand which counties experience strong winds and have capacity for more turbines. Previously, answering this question required sourcing a wind speed raster, sampling it into every county, counting existing turbines against the same boundaries, then filtering and ranking the result, a day of GIS work before the first candidate appeared.
Now, it just takes asking the question. Felt AI handles the workflow in one request. It finds the data, runs the raster and vector analysis, and returns a ranked map of candidate counties, ready to inspect, share, and build on. Anyone in an organization can go from a question to an answer about the places they are responsible for, and decisions get made at the speed of the business rather than the speed of the analysis queue.
One platform, dozens of new raster capabilities
With dozens of new raster capabilities in Felt, your team can now quickly and easily explore scenarios on the fly. Every raster layer now reports the statistics behind what it displays, and you can interact with them in several ways:
Run zonal stats with 'Sample raster'
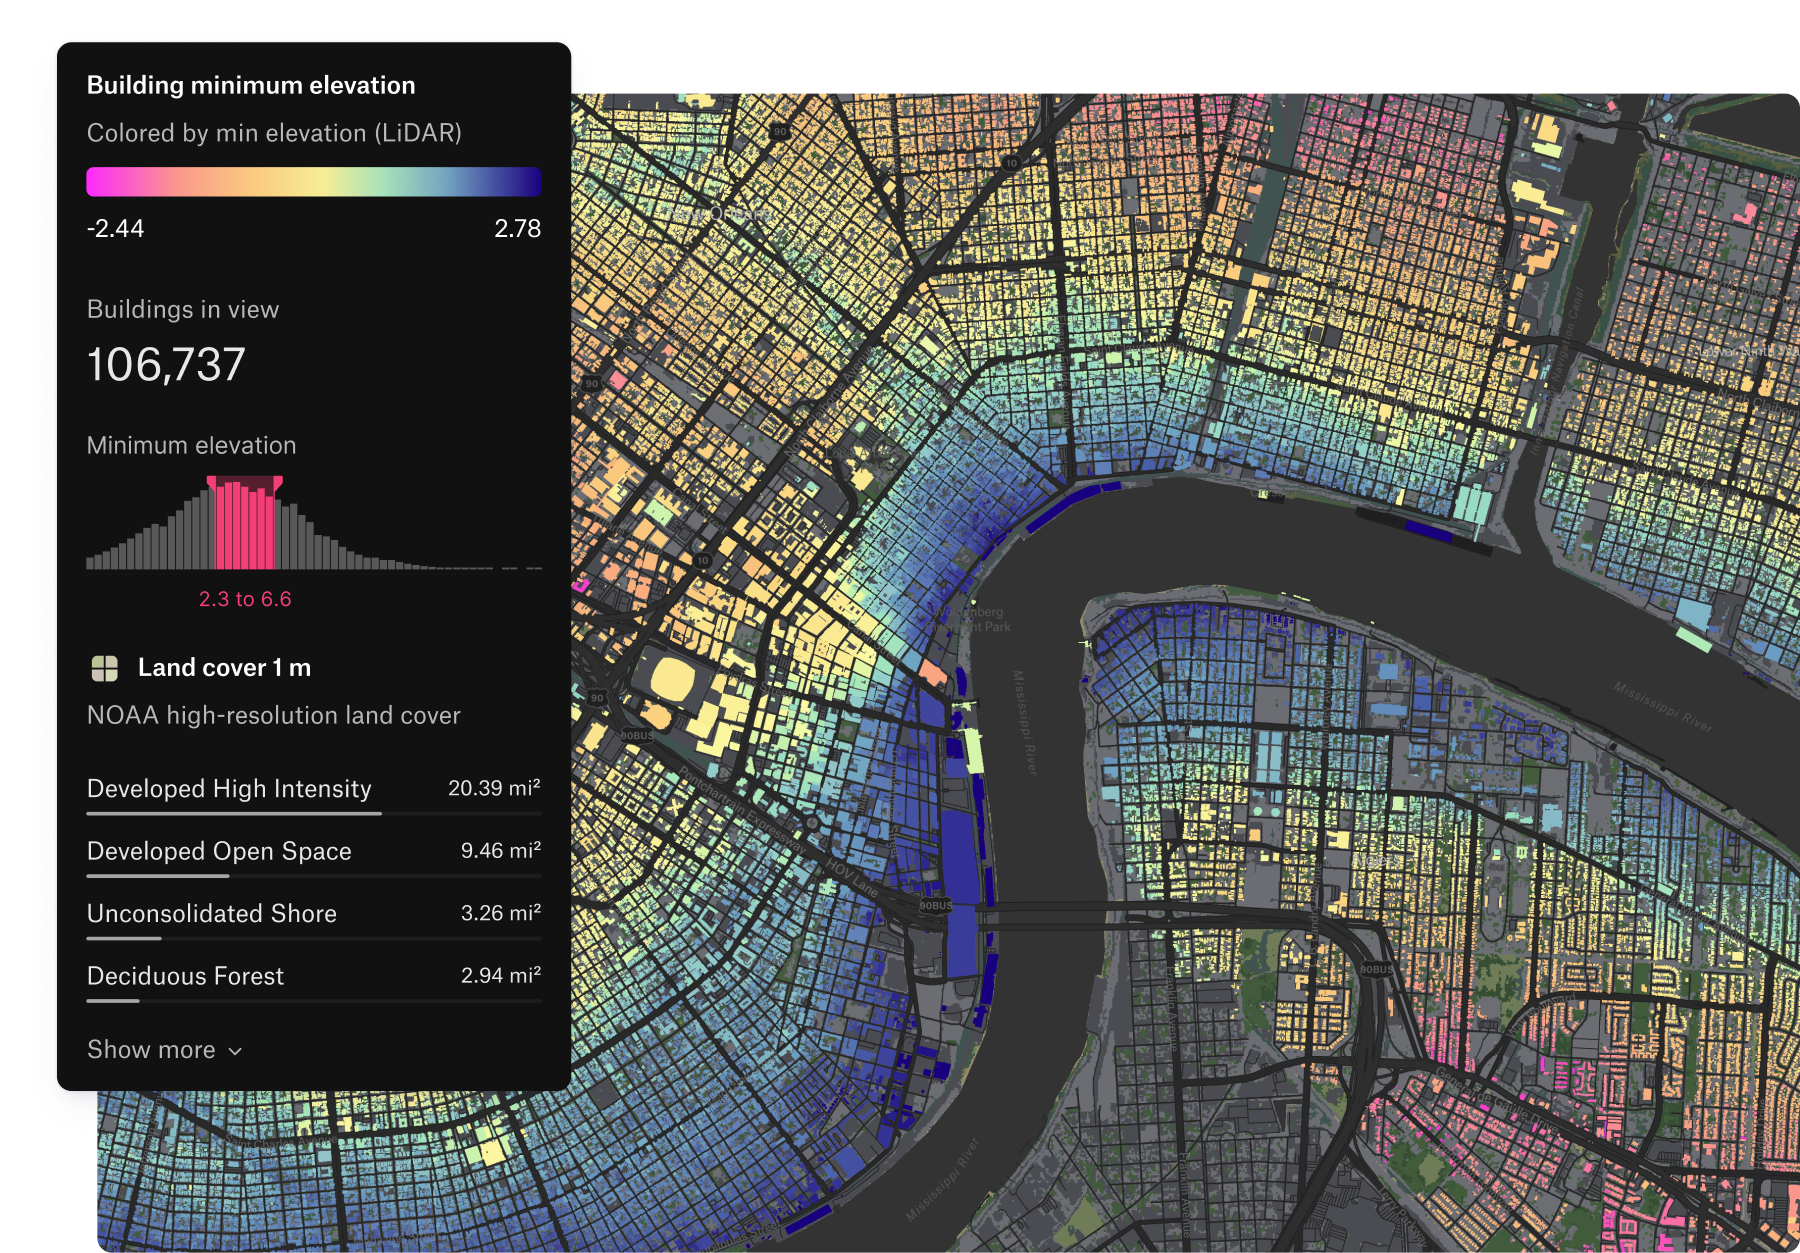
Now you can choose a raster, the bands and statistics you need, and the vector layer to apply them to. Points get the pixel value at each location, lines get values along each feature, and polygons get summary statistics for the pixels within each boundary:
Analyze raster bands
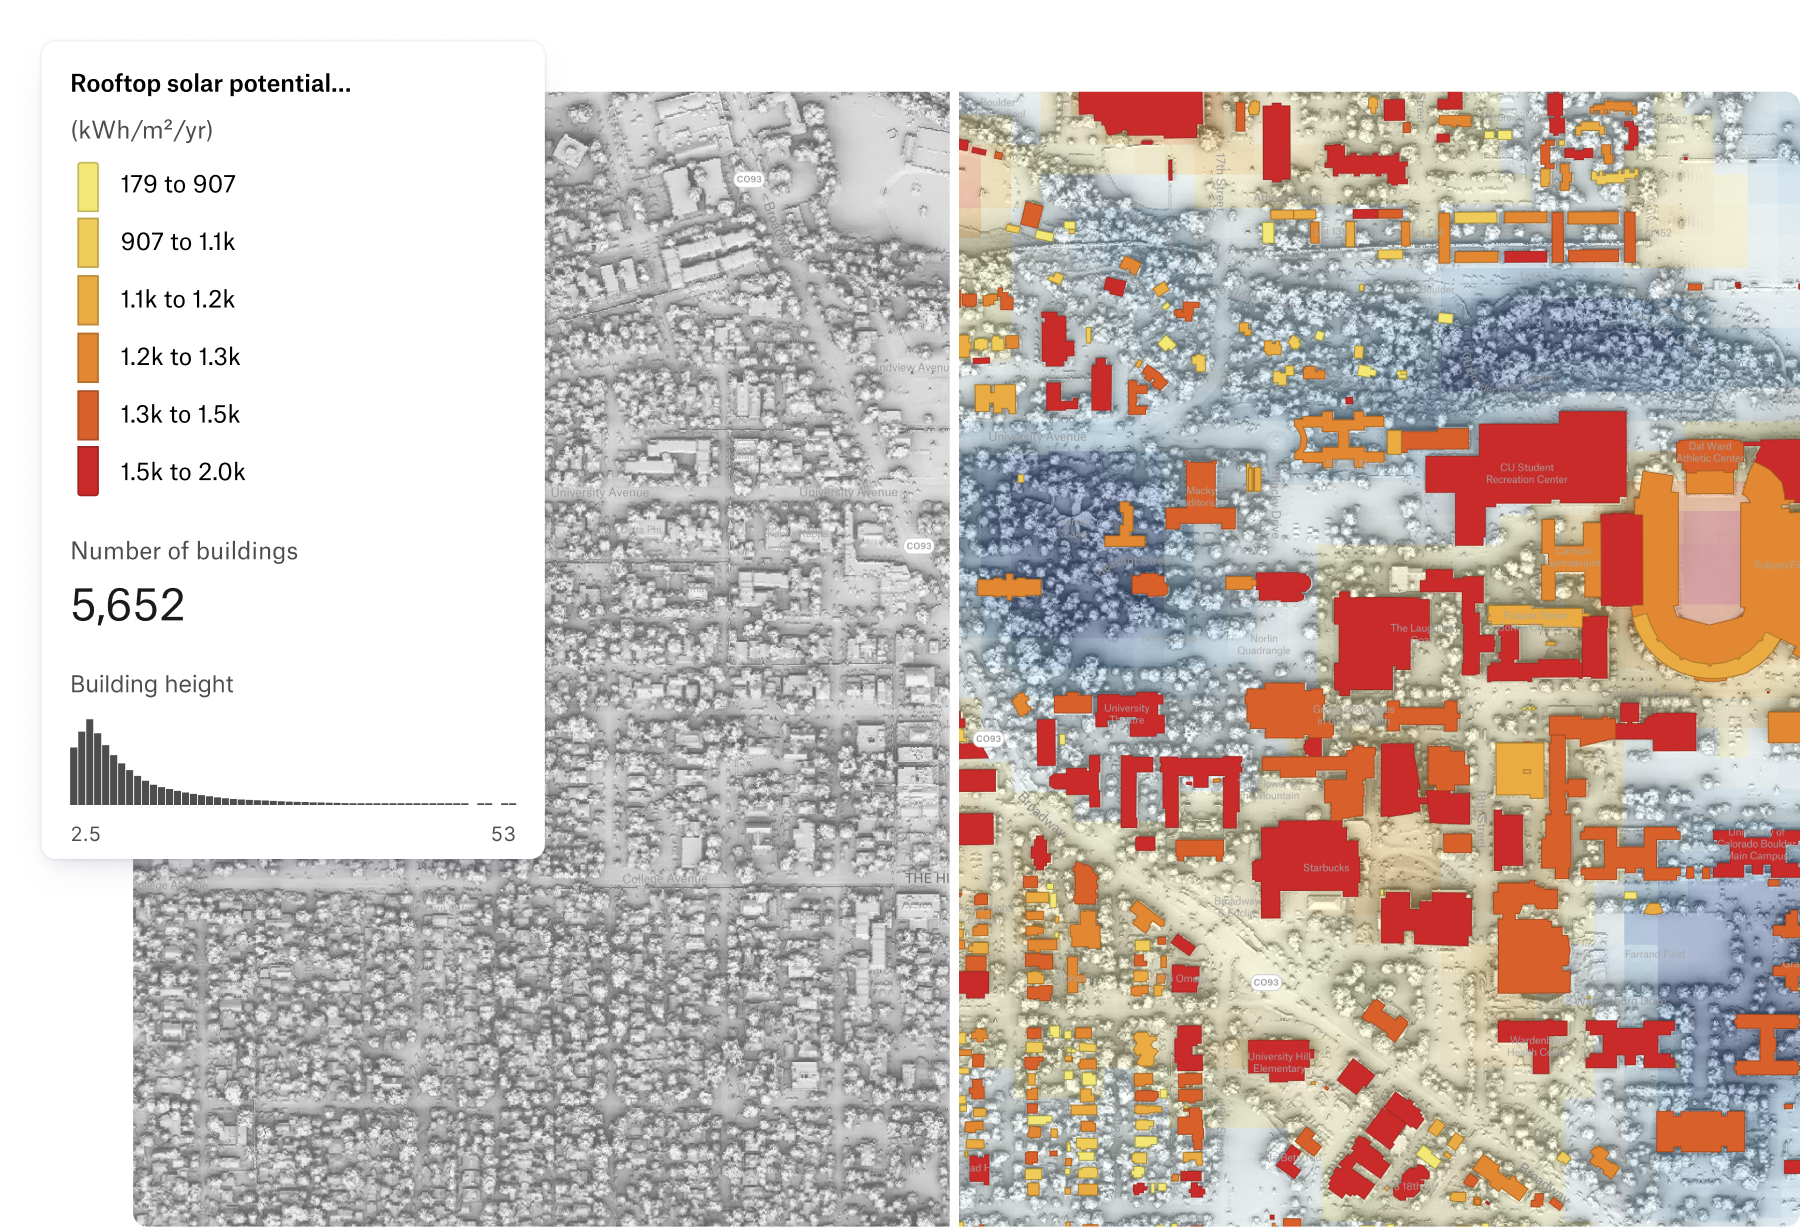
Stat cards, histograms, bar charts, and filters, the components that make a Felt map a dashboard, now read raster bands. Components can also run off derived bands such as NDVI, NDMI, or NDWI as well:
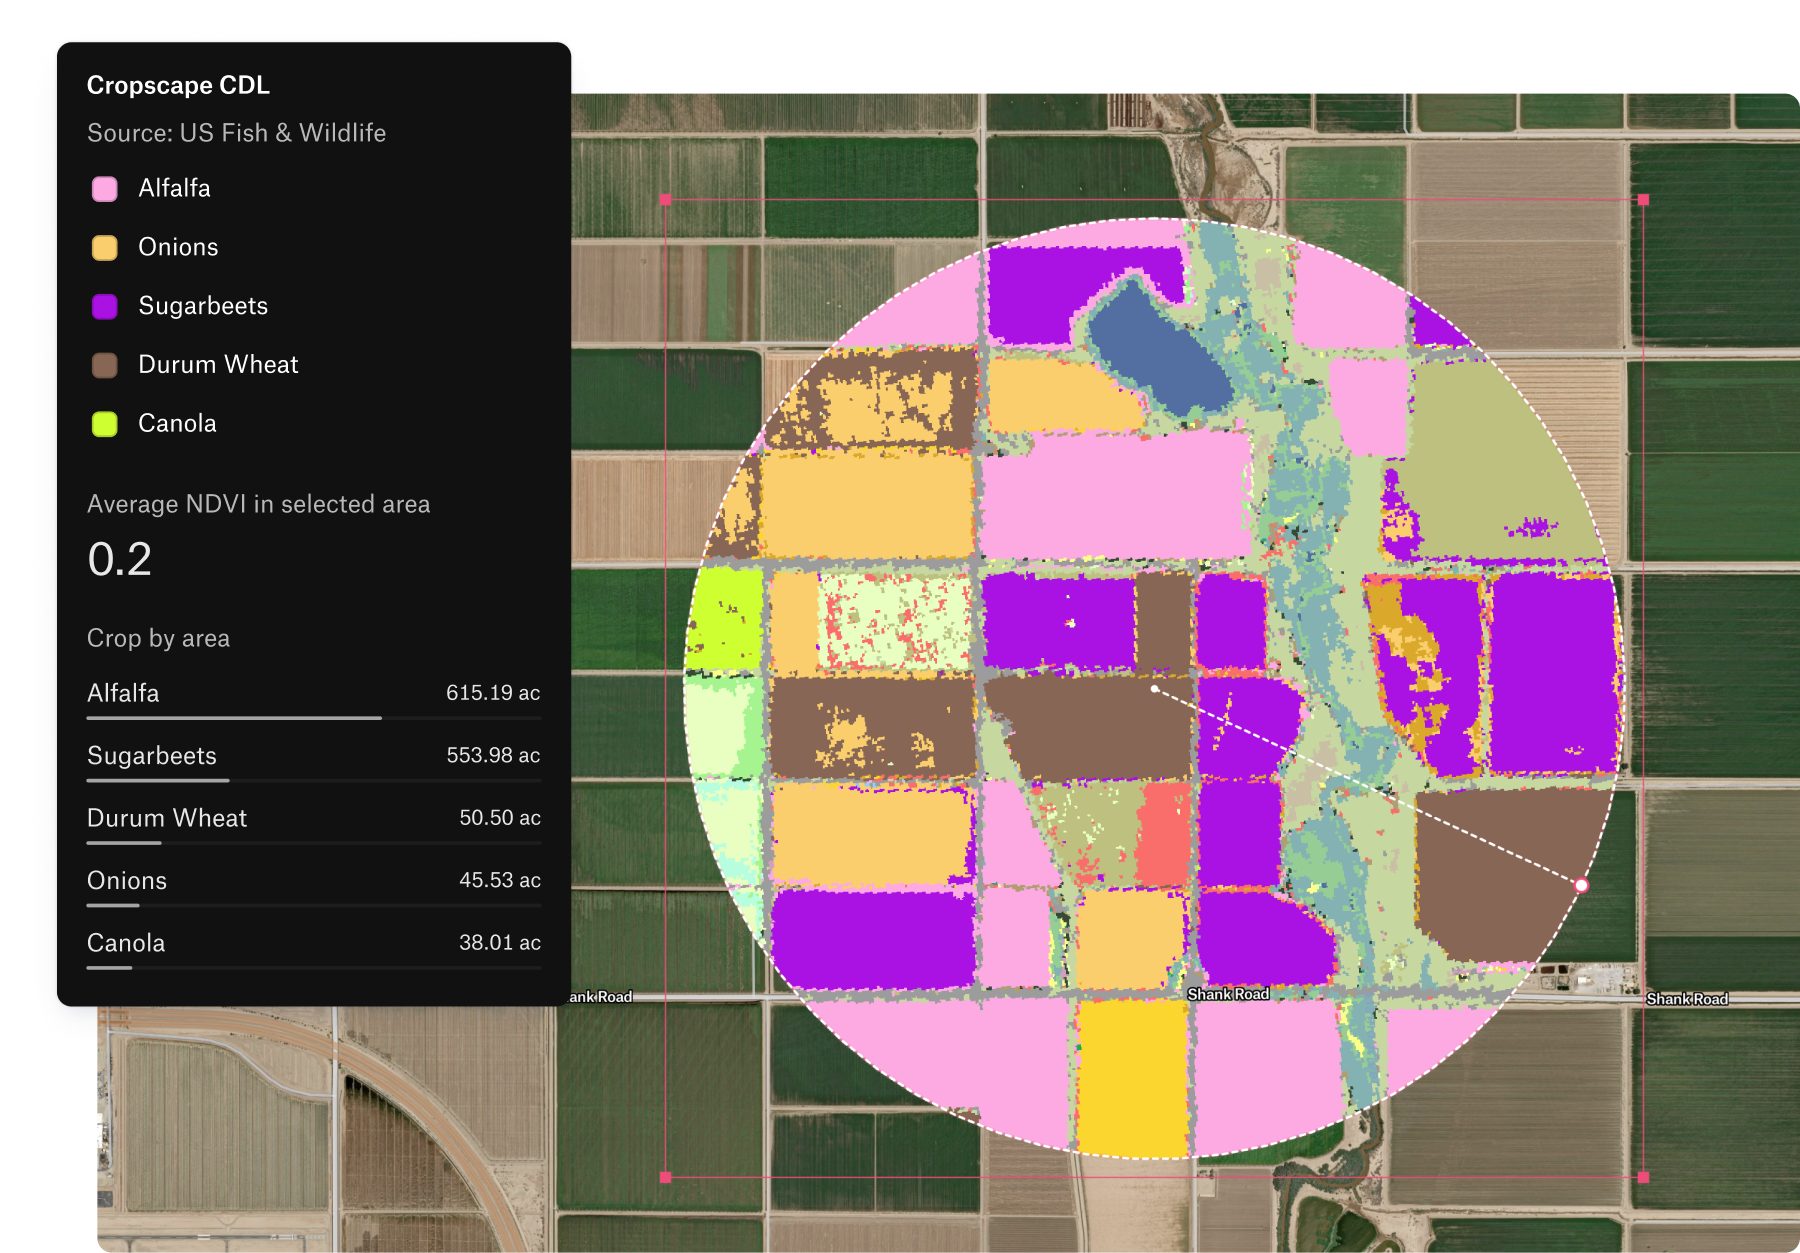
Focus the analysis on one area with a spatial filter
Outline a site or a district and every raster on the map is clipped to it, each reporting a headline number for that area:
Profile any route with the Measure tool
Measure a distance or route and see how raster values change along it, such as the elevation profile of a proposed pipeline or trail:
.png)
Together these make raster analysis fast and interactive – allowing your team to explore multiple scenarios as-needed. Move a boundary, select a range, trace a route, or switch to a different index, and the results update in place.
The better way to work with rasters
Today's release changes what's possible for organizations that rely on raster data for insights. Experience world-class raster analysis alongside your core workflows, with resulting maps that are performant and easy to share across the organization. Try it now.
Compare Felt using AI