Traffic flow analysis: How traffic data is collected and used to understand traffic patterns
Traffic flow analysis gives transportation planners clear insight into real-world conditions. It turns raw data into practical guidance, such as where to add a turn lane, how to adjust signal timing, or which routes need congestion relief. Modern tools make it easier for teams to consistently monitor movement data and improve traffic management, enhancing safety for everyone on the road.
Let’s take a closer look at what traffic flow analysis is, including where that data comes from and how analysts use it to optimize everyday travel.
What is traffic flow analysis?
Traffic flow analysis is a specialized geospatial technique used to study how vehicles move across road networks, including busy freeways and neighborhood streets. Modern analyses also track pedestrian, cyclist, and transit flows, with the goal of identifying congestion and safety issues that guide infrastructure improvements.
Every analysis focuses on three core variables:
- Traffic volume: How many vehicles pass the same point within a set period.
- Traffic speed: How fast vehicles travel down a segment of road.
- Traffic density: How closely vehicles are spaced on the road.
These data points describe current roadway conditions and show where traffic flows smoothly or slows down. Transportation managers and engineers use traffic flow analysis in urban planning projects, primarily to evaluate network performance and anticipate future demand.
Traffic flow analysis tools: How data is collected
Whether it’s cameras counting vehicles or modeling software visualizing traffic jams, these tools determine what you can measure, analyze, and improve in the network.
Roadside sensors and traffic counters
Roadside sensors and traffic counters sit along streets and highways, counting individual vehicles and recording how fast they’re moving. This data helps monitor congested traffic at known hotspots and verify whether traffic models match actual conditions.
Cameras and computer vision systems
Cameras paired with computer vision software watch traffic in real time. They identify lane use, detect congestion, and flag collisions or other incidents as they occur. Transportation teams deploy these systems at intersections and in traffic management centers to help teams respond quickly to emerging issues.
GPS and mobile location data
GPS data from navigation apps and mobile devices shows how vehicles move along the entire network, not just at fixed sensors. It’s one of the most popular tools for understanding traffic patterns because it provides a continuous view of travel time and route choice on both freeways and local streets.
Connected vehicle and telematics data
Connected vehicles and telematics systems collect real-time data using embedded GPS, sensors, and wireless technologies. These tools track movement and driver behavior — like mean speed and average acceleration. This helps teams pinpoint performance issues and quickly detect traffic incidents.
How traffic flow analysis is performed
Transportation teams use different analysis methods to study flow patterns. Some help forecast long-term travel demand, while others look at traffic patterns across a city or entire region. Most planners and traffic engineers use multiple methods to get a complete view of network performance.
Travel demand modeling
Travel demand modeling forecasts future traffic on roads and highways by analyzing:
- Population data: Estimates how many trips originate or end in each area.
- Employment centers: Helps predict commuting patterns and peak traffic flows.
- Land use: Shows trip purposes and likely travel routes.
- Traffic volumes: Measures actual road use to calibrate the model.
Using this information, teams can anticipate vehicle volumes, peak travel times, and likely congestion points. These insights make it easier to plan new roads and evaluate the impact of development projects.
Traffic simulation
Traffic simulation uses mathematical models to build a virtual version of a road network. It factors in vehicle volumes, signal timing, and driver activity to identify bottlenecks and measure delays under different traffic conditions. Simulation models also help test changes, like lane expansions or new speed limits, before implementing them on real roads.
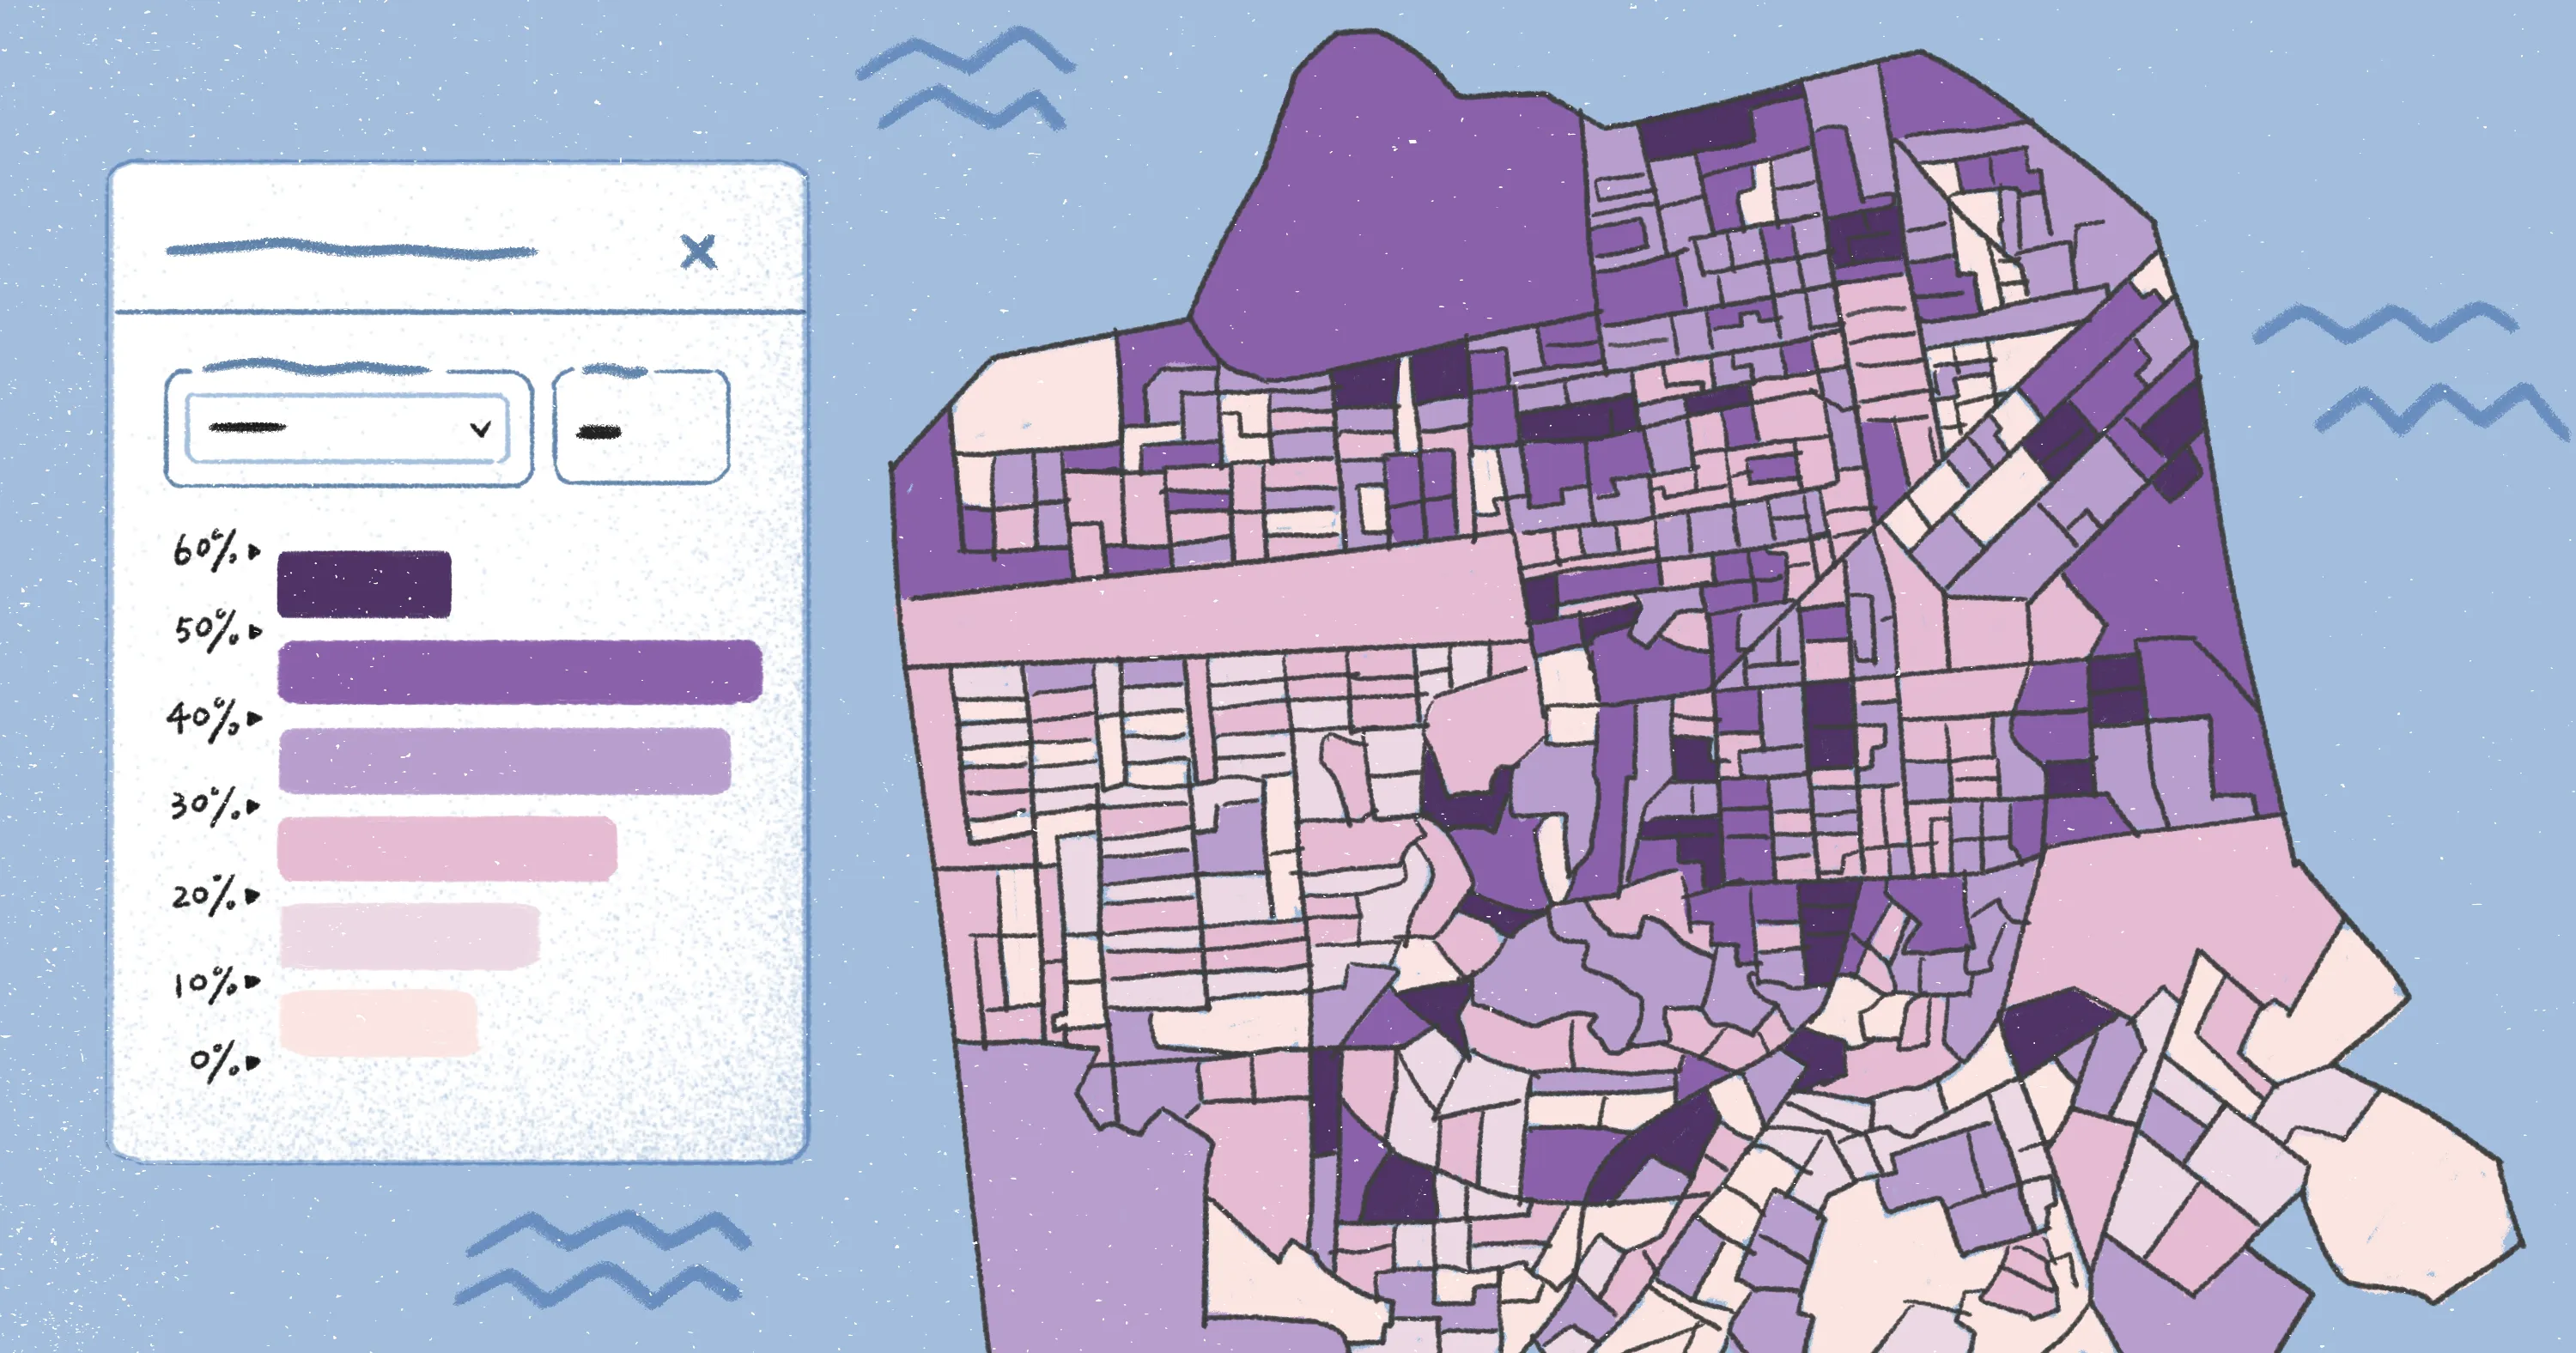
Spatial traffic analysis
Spatial traffic analysis uses advanced GIS technology to examine traffic patterns. It draws on real-time information from sensors and GPS devices to create heat maps, highlight congestion hotspots, and report on problem areas.
Felt’s browser-based workspace makes spatial analysis simple. Users can quickly visualize complex traffic data and evaluate how incidents or construction influence movement. This shared environment supports real-time collaboration, which helps teams stay aligned and ready to act on the data.
Key applications of traffic flow analysis
Here are a few ways traffic flow analysis shows up in real-world scenarios.
Congestion monitoring and bottleneck detection
Traffic flow analysis helps teams pinpoint congestion and the road segments that trigger delays. When planners track traffic volume and headway, it’s easier to spot recurring bottlenecks and target improvements. This might mean adding extra lanes or implementing detours to shorten travel times.
Traffic signal timing optimization
Analyzing traffic patterns at intersections allows engineers and road surveyors to fine-tune signal timings. They get an in-depth look at peak flows, turning movements, and queue lengths — helping optimize traffic lights and minimize wait times. Not only does this improve safety, but it reduces delays from stop-and-go congestion.
Infrastructure and corridor planning
Infrastructure decisions rely on clear traffic insights. Without them, resources can be misdirected. Traffic flow analysis shows which roads and corridors are under strain so planners can prioritize widening projects, new link roads, and intersection upgrades. This ensures improvements focus on areas that will have the biggest impact on mobility.
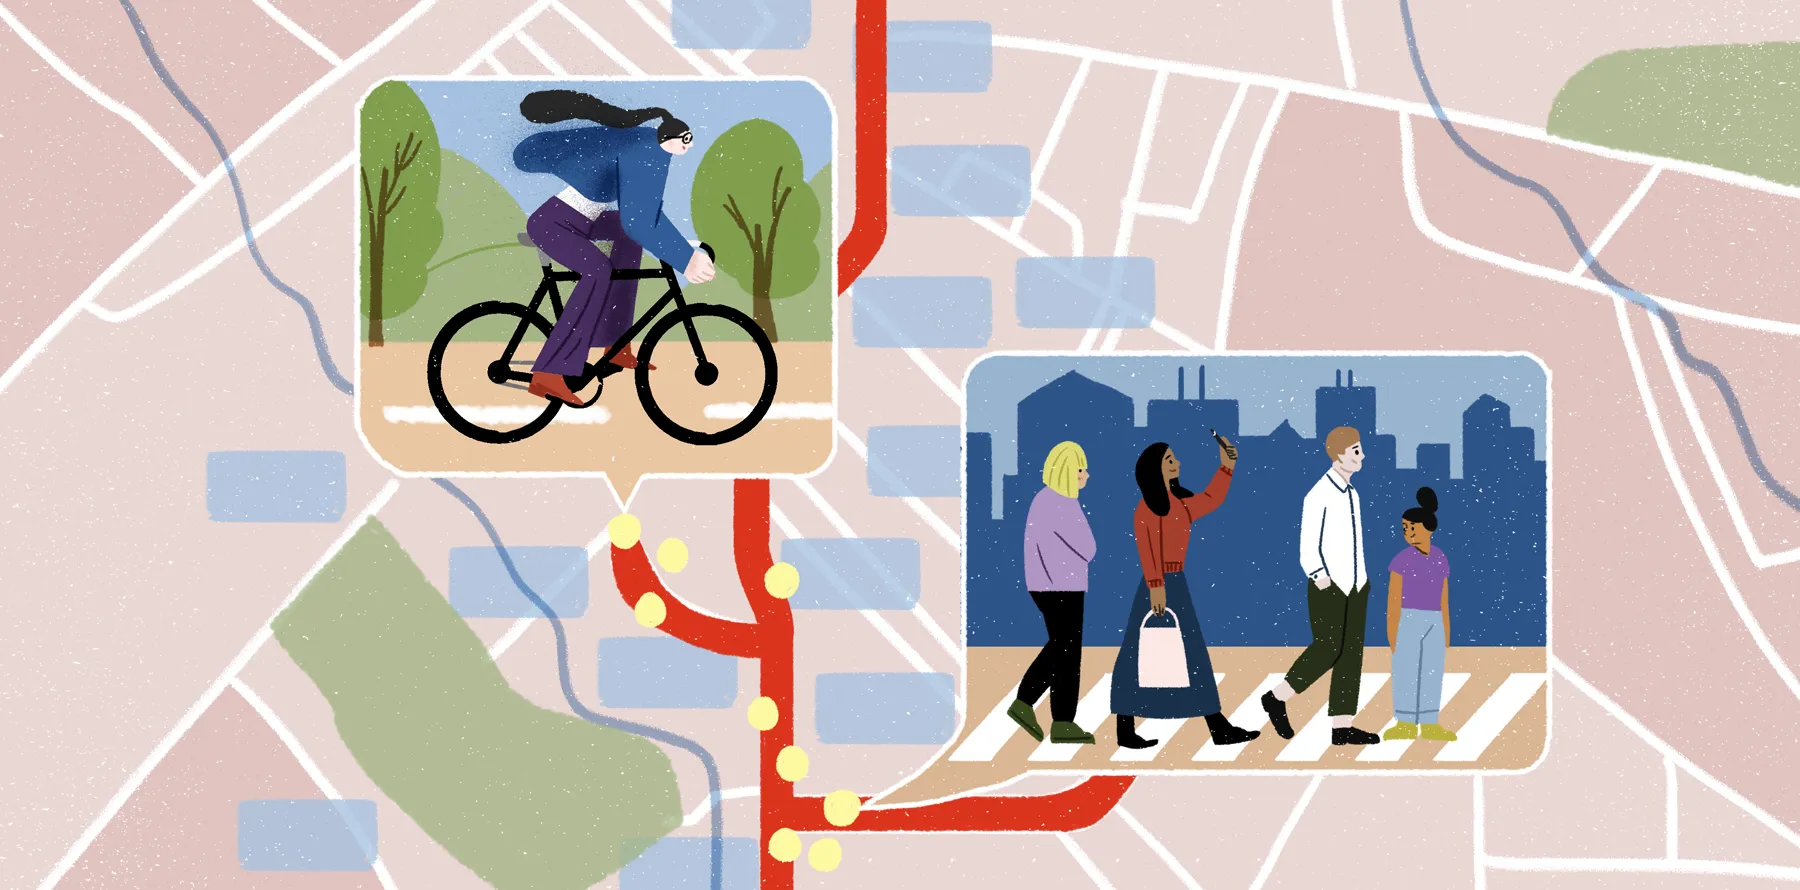
Urban mobility and multimodal planning
Traffic flow analysis isn’t limited to personal or commercial vehicles. Transportation teams also track pedestrian counts, cycling activity, and public transit usage so they can plan for all modes of travel and design road networks that work for everyone. For example, flow analysis helps teams plan where to add bike lanes or put crosswalks.
The key to traffic flow analysis is having data that’s current, accessible, and easy to share with the people who need it. When everyone works from the same live information, they can pinpoint issues faster and make decisions that reflect what’s happening on the ground.
How Felt supports traffic flow analysis
The challenge in traffic flow analysis isn’t generating insight, but making sure those insights connect to live data and are accessible. Too often, information gets pulled into static reports or one-off maps — making it harder for planners to stay aligned as conditions change.
Felt addresses this gap by giving teams an enterprise-ready Web GIS platform that connects directly to your existing data sources, including:
- Postgres/PostGIS
- Snowflake
- BigQuery
- Databricks
- Amazon S3
Instead of constantly exporting and rebuilding, you can create interactive maps, apps, and dashboards that sync with their underlying data.
Felt doesn’t replace traffic simulation tools or demand models. Teams still use those methods to develop forecasts and test scenarios. Instead, Felt helps turn your traffic data into interactive applications in minutes.
With Felt AI, teams can generate interactive maps and dashboards from a single prompt without writing code. For example Commuter Flow Explorer is a prompt-driven application you can create using Felt AI. It turns movement into a clear, visual format. Felt then provides the shared spatial workspace where teams can visualize patterns, explore results, and align stakeholders around what the data shows.
Start a 7-day Enterprise trial and see what traffic data looks like when it’s live and accessible to your entire team.
FAQ
What are the benefits of traffic flow analysis?
Traffic flow analysis helps planners spot congestion and delays so they can make targeted improvements to local infrastructure. This leads to smoother travel and shorter commutes while enhancing safety in high-traffic areas.
What software helps with traffic flow analysis?
Teams use a mix of tools for traffic flow analysis, including simulation software, demand modeling platforms, and GIS technology. Many also rely on cloud-based tools to connect multiple data sources and share insights across stakeholders.
What factors affect traffic flow?
Traffic flow depends on several key factors, including vehicle volume, road design, and driver behavior. External conditions like weather and construction can disrupt normal traffic patterns and create more congestion.
What should you look for in a traffic data visualization tool?
A useful traffic visualization tool should help teams quickly understand what’s happening on the road in real time. It should connect to your live data sources, display patterns that are easy to interpret, and give teams a shared view of conditions as they change.
Compare Felt using AI