


Isochrone maps show how far you can travel from a starting point within a set amount of time. Rather than using straight-line distance, they factor in real-world conditions like road networks and traffic to create routes and estimates that reflect how people actually move. For example, businesses can design driving radius maps to identify average employee commutes.
To build an isochrone, you need platforms that calculate travel routes and consider current geospatial data. These tools use up-to-date information, often through third-party software, to ensure maps depict realistic travel-time boundaries.
Let’s look at the best isochrone map generators, from no-code software to advanced analytics tools.
Top 9 isochrone map generators to calculate travel time
Below are the best travel map makers available today. Each tool has its own approach to travel-time analysis, with differing levels of customization and control.
1. Felt AI extensions
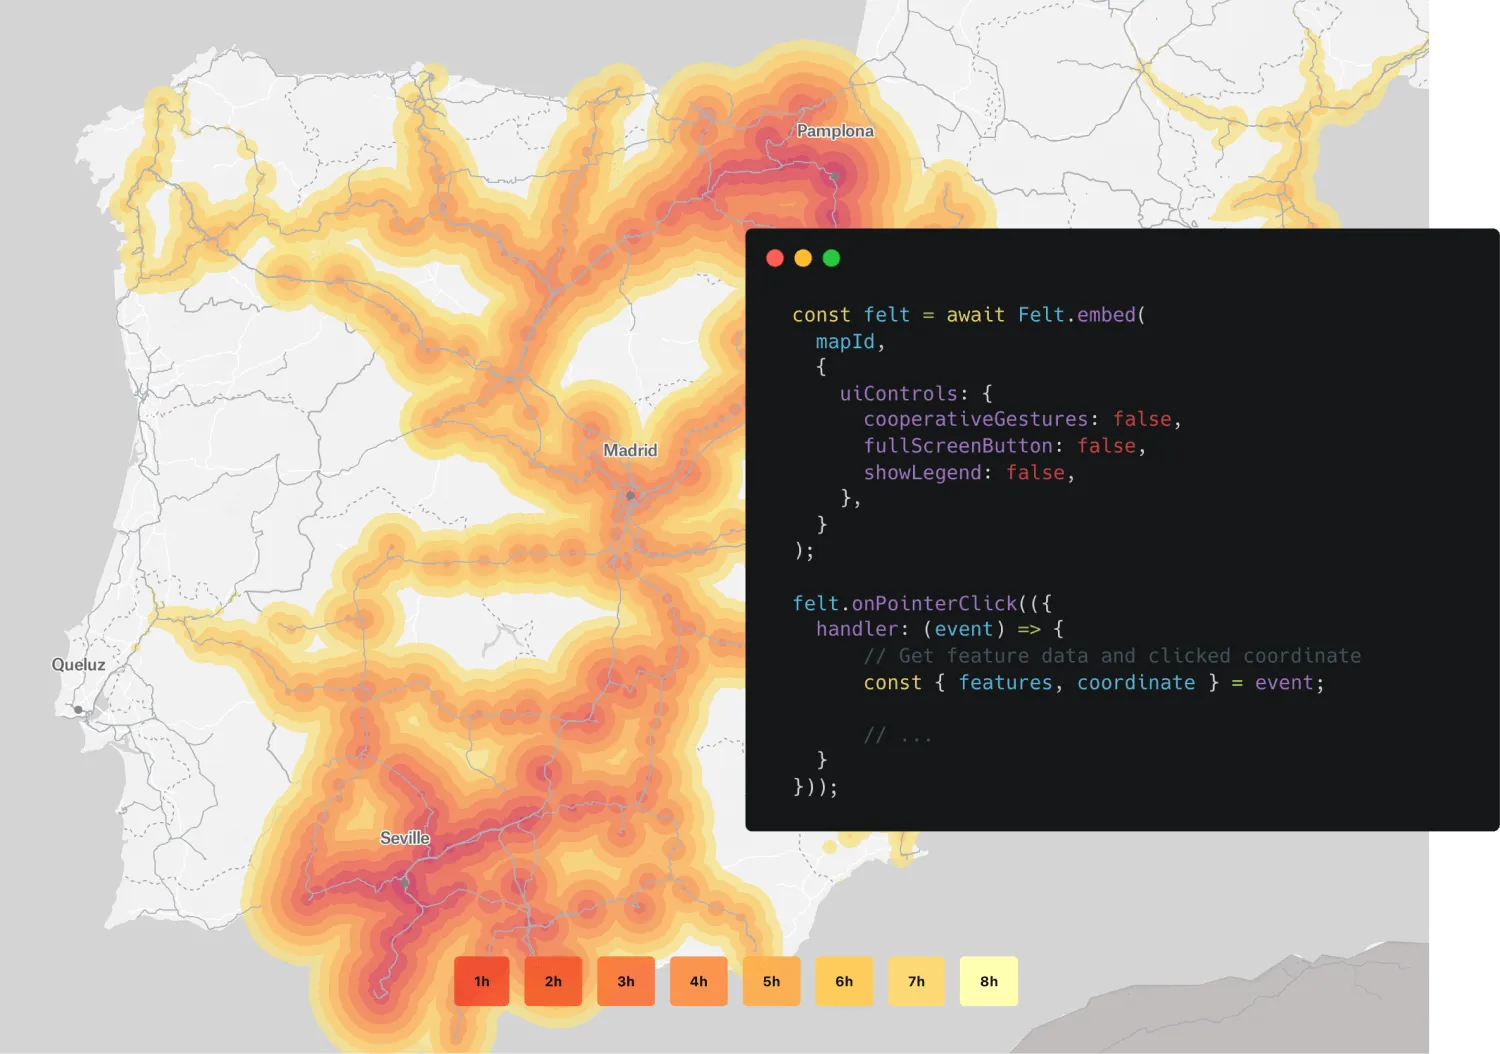
Felt is a flexible geographic information system (GIS) that lets you create travel time maps without locking you into a single provider. Instead of using one built-in engine, you can generate isochrones using Felt’s application programming interface (API) to connect to various platforms. This is ideal if you already rely on a specific routing service or want to compare multiple data sources. For example, you can connect Felt with QGIS to easily move between a collaborative, browser-based map and a deeper, analytical workflow.
This platform also works with routing engines, allowing you to quickly grab an API key from software like Geo API to flesh out isochrone maps faster.
Pricing: Unlimited free plan, paid plans start at $200/month
Integrations: Routing APIs, QGIS plugin, and databases like Snowflake and Postgres
Best for: Teams that need a flexible, collaborative mapping solution
2. TravelTime API
TravelTime API generates isochrones for a single location and handles large-scale analyses. It calculates travel times, provides directions, and offers geocoding. TravelTime is only an API, which means it isn’t standalone software — you’ll need to integrate it into your GIS, logistics, or real estate software.
Pricing: Available upon request
Integrations: Software development kits (SDKs) for Python and Java, plus no-node connections with Salesforce, Slack, and ArcGIS
Best for: Developers who want an integrated platform
3. Mapbox
Mapbox offers travel map functionality through its routing and isochrone APIs. You can adjust parameters like time thresholds and distances, then overlay them with other data layers for deeper visualizations. Because it focuses on custom development, Mapbox requires a fair amount of technical skills to get the most out of it. However, teams can use the free Mapbox Studio for no-code maps, though they’re a bit more simplistic.
Pricing: Pay-as-you-go pricing based on map loads and API requests
Integrations: Various, including JavaScript web apps and business intelligence tools like Tableau and Microstrategy
Best for: Tech-savvy teams that need in-depth visuals
4. Geoapify
Geoapify has a straightforward isochrone API designed for quick integration. Design travel-time areas for your routing scenario, and the API returns results in standard formats like GeoJSON and CSV. It uses APIs to access geospatial data from OpenStreetMap, a community-driven database, making it easier for developers to leverage this open-source information.
Pricing: Free plan; paid plans starting at $59/month
Integrations: Various, including front-end libraries and community data sources
Best for: Developers looking to add community data to their workflows
5. Smappen
Smappen is a browser-based tool designed to create isochrone maps without GIS tools or experience. It works in three steps: Drop a pin on your starting location, pick your travel mode (e.g., driving or cycling), and choose how long you’re willing to travel. Smappen then generates a time map, showing you the areas you can reach within those constraints.
Pricing: Free plan; paid plans starting at $99/month
Integrations: Hubspot CRM and Microsoft Excel
Best for: Non-technical users
6. QGIS
QGIS is an open-source GIS platform that lets you create isochrone maps using plugins to connect to external routing engines. It gives you complete control over data, projections, and styling. You can combine isochrones with other spatial data sets to produce highly customized visualizations and run detailed queries.
Pricing: Free and open source
Integrations: Felt, routing APIs, PostGIS, and external data sources
Best for: Advanced users that need full analytical control
7. OpenTripPlanner
OpenTripPlanner’s open-source routing engine is built for multimodal travel and public transport analysis. Cities and mobility planners use it to analyze accessibility and map out new transit networks. Because OpenTripPlanner is self-hosted, you’ll need to install and configure it yourself. This gives you a bit more control over routing logic and data sources, but you’ll need some programming knowledge to do it.
Pricing: Free and open source
Integrations: Custom apps and GIS tools like Felt
Best for: Technical teams working on public transportation projects
8. ArcGIS
Both ArcGIS Online and ArcGIS Pro have tools for generating isochrone maps. They let you calculate travel-time areas for driving, walking, or public transit, then customize the output with multiple layers. You can also integrate other spatial data sets for deeper analysis. Both tools are a bit complex, but they connect to collaborative platforms like Felt for easier sharing.
Pricing: Hybrid model that combines annual subscriptions with perpetual licenses
Integrations: ArcGIS ecosystem, databases, and enterprise business software like Salesforce and Microsoft
Best for: Enterprise organizations
9. Alteryx
Alteryx is a data analytics platform that blends spatial analysis with data science automation. Its isochrone capabilities let you create travel-time areas and service regions, then fold them into large workflows for tasks like site selection and market accessibility studies. It’s a relatively simple program at first but ramps up in difficulty with larger projects.
Pricing: Available upon request
Integrations: Business intelligence tools like Tableau and Uipath and databases like Snowflake and SQL
Best for: Business analysts and data scientists
How to make an isochrone map in 5 steps with Felt AI
Creating an isochrone extension with Felt is simple and flexible. Using Felt AI and an isochrone API, you can build an interactive tool that generates travel-time polygons directly on your map — with just a few prompts.
What You'll Need
- A Felt Enterprise account (all new accounts include a 7-day free trial)
- An API key for an isochrone service — such as Geoapify, Mapbox, TravelTime, or HERE
Step 1: Get your API key
Sign up for an isochrone API provider and copy your API key. This example uses Geoapify. Once you create a free account, start a new project and an API key is generated automatically. The free tier includes access to their Isoline API, which handles isochrone calculations.
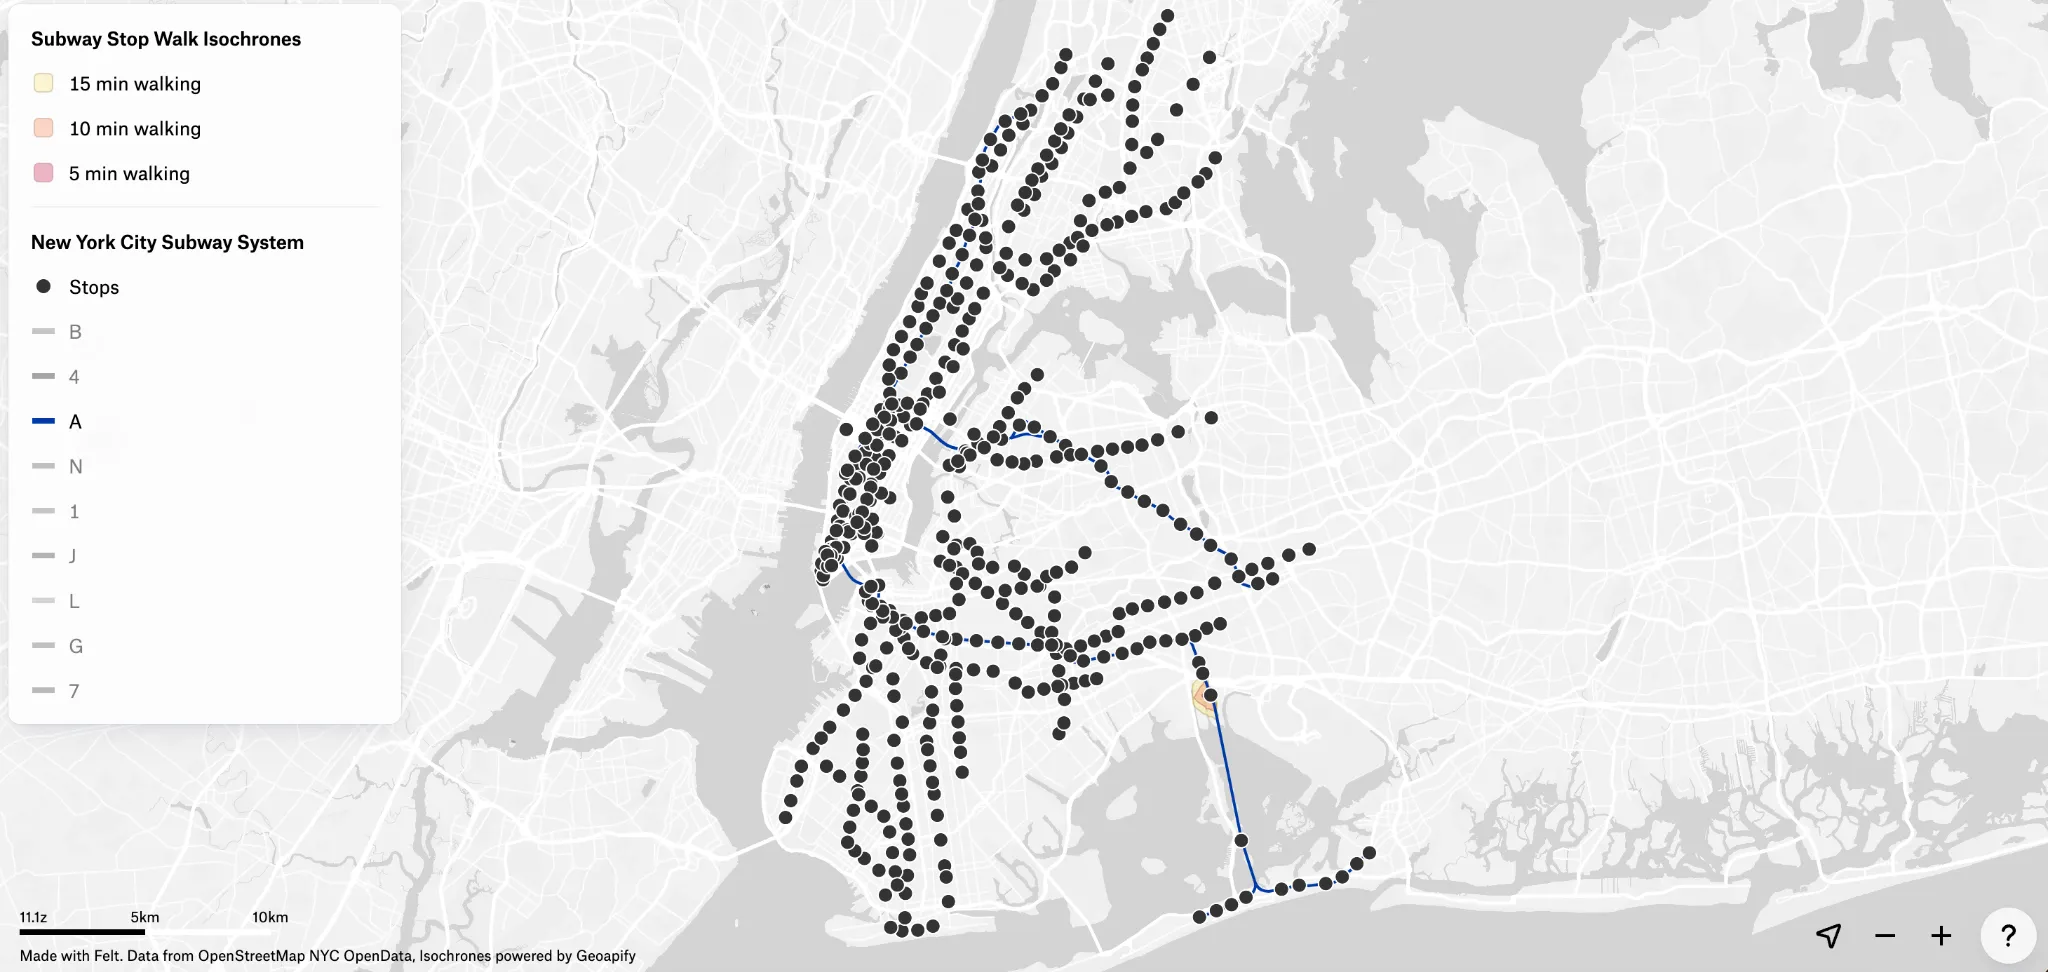
Step 2: Add your map data
From your Felt map, click the Library icon in the top toolbar to access Felt's layer library. Search for "New York City Subway System" and add it to your map. Once it loads, zoom in to see the subway stops and lines.
You'll notice the dataset includes entrances in addition to stops and lines. Since the extension only needs stops, switch to list view, select the Entrances layer, and delete it from the map. This keeps things clean and prevents unwanted click interactions.
Alternatively, use Felt's upload feature to bring in your own dataset.
Step 3: Build the isochrone extension
Click the App development icon in the toolbar, then select Custom extension. This opens a chat panel alongside a code window and a live map preview.
Paste the following prompt to build the core behavior:
“Build an extension that generates travel-time isochrones when a user clicks on a subway stop. Use the Geoapify Isoline API to show 5, 10, and 15-minute isochrone polygons on the map. My API key is [YOUR_API_KEY]”
Felt AI will generate the code and show you its approach. Once it finishes, click on a few subway stops to confirm the isochrones are drawing correctly before moving on.
Step 4: Add a travel mode panel
For a better user experience, add a sidebar that lets users switch between travel modes. Paste this prompt:
“Add a sidebar panel with a radio group to select a travel mode: Walk, Bike, or Drive. Regenerate the isochrones when the mode changes.”
A panel will appear on the right side of the map. Click a subway stop and try switching between Walk, Bike, and Drive to confirm each mode generates updated isochrones.
Step 5: Style your map and save
Refine the visual presentation using a mix of Felt's built-in styling tools and Felt AI.
For the subway data, use Felt's style editor to style the subway stops and lines. First, select the subway stops layer and choose a train icon, then color the subway lines by their actual line color using the style-by-category option. You can also switch the basemap for example, Felt’s light basemap works well for a map like this so the context (subway) and isochrones come to the foreground.
For the isochrone colors, use the AI chat:
Use a sequential color palette for the isochrones so each travel time polygon is colored from light to dark to show distances more clearly.
When you're satisfied, click Done. The extension will be active in view mode, and you can share the map via link or invite collaborators directly. If you need to make edits later, return to edit mode and click back into the Custom extension panel.
Upload anything on Felt and start creating maps today
Isochrone maps are an amazing resource to realistically calculate time and distance, and they’re easy to create. Pick a tool that fits your team’s goals and workflows, and start generating intuitive, interactive maps. If you’re looking for a tool that balances simplicity and depth, try Felt.
Felt’s browser-native GIS lets you build apps and maps with data your team can rely on. Connect with QGIS and generate maps with Felt’s Upload Anything feature. This lets you import and analyze any type of file, from spreadsheets to CSVs. Felt also lets you sync directly with live data sources and enjoy real-time updates, whether you’re building drive time maps or choosing sales territories.
Book a demo with Felt and create accurate maps without tool switching.
Compare Felt using AI


.webp)

