The best Google Maps drawing tools alternative
Have you ever created a custom map using Google Maps drawing tools? If so, you know it’s not as easy as it seems. Adding a single icon or sketching a route can turn into a tedious process — you find yourself jumping between menus, managing layers, and working around limits that make creating a map harder than it should be.
As great as Google Maps is for directions, it can be frustratingly rigid for drawing maps. Luckily, Felt can help.
With intuitive tools designed for speed and clarity, Felt helps you move beyond the limits of Google Maps drawing tools and create maps that are easy to style, easy to share, and easy for your team to understand. No workarounds or extra steps; just compelling maps that do what you need them to do.
Read on to learn how Felt’s drawing tools work and how you can use them to create a stunning, easy-to-understand map.
How to draw on Google Maps: 5 key tools
Google Maps has a small set of built-in tools for basic mapmaking. You can drop pins, draw lines, and outline basic shapes. These features work fine for one-off tasks like marking a location, but anything more detailed requires multiple steps and still falls short of producing a data-rich map. That’s why many teams look for alternatives that make drawing on a map faster and more flexible.
Here are the main Google Maps drawing tools and what they’re typically used for:
- Add markers (icons): Drop an icon on the map to highlight a specific location. You can change the icon style and color, but customization options are limited.
- Draw lines or shapes: Use Google Maps line tools to draw lines or shapes for routes, boundaries, and areas of interest. This works for basic visuals but lacks precision.
- Create and manage layers: Organize your map using layers to separate points, lines, and areas. Keep in mind, these layers get clunky with more complex visuals.
- Add labels: Attach names or short descriptions to markers and shapes to give context to your map, but note that text formatting options remain basic.
- Measure distance or area: Use the ruler icon to measure distances between points or calculate the area of a shape. This is useful for quick estimates or radius maps.
Google Maps alternative to draw on a map your way
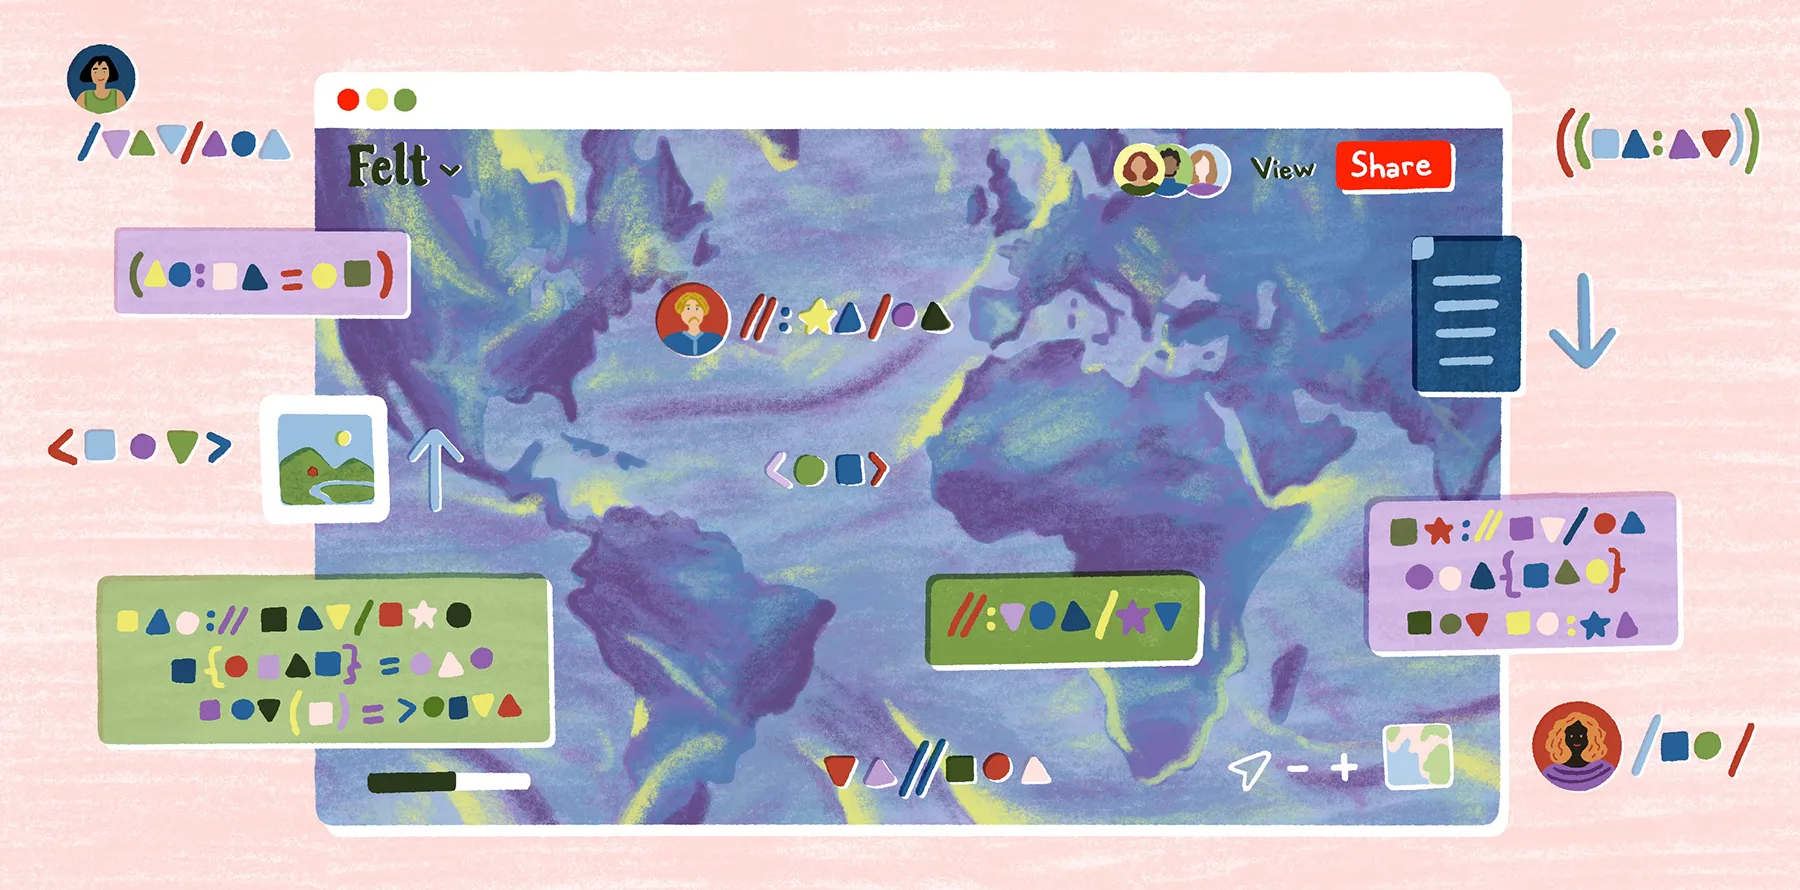
Felt is a powerful mapping tool that doesn’t just upload and analyze data. It offers a full suite of drawing tools so you can create personalized, interactive maps and visuals. Better yet, you can easily share your work and collaborate with others in real time.
Unlike Google Maps drawing tools that rely on basic shapes and manual workarounds, Felt gives you precise, geometry-based tools. You can work with real boundaries, structured layers, and dynamic map elements. Here’s a look at the focused tools that help you create a map that scales as your project grows.
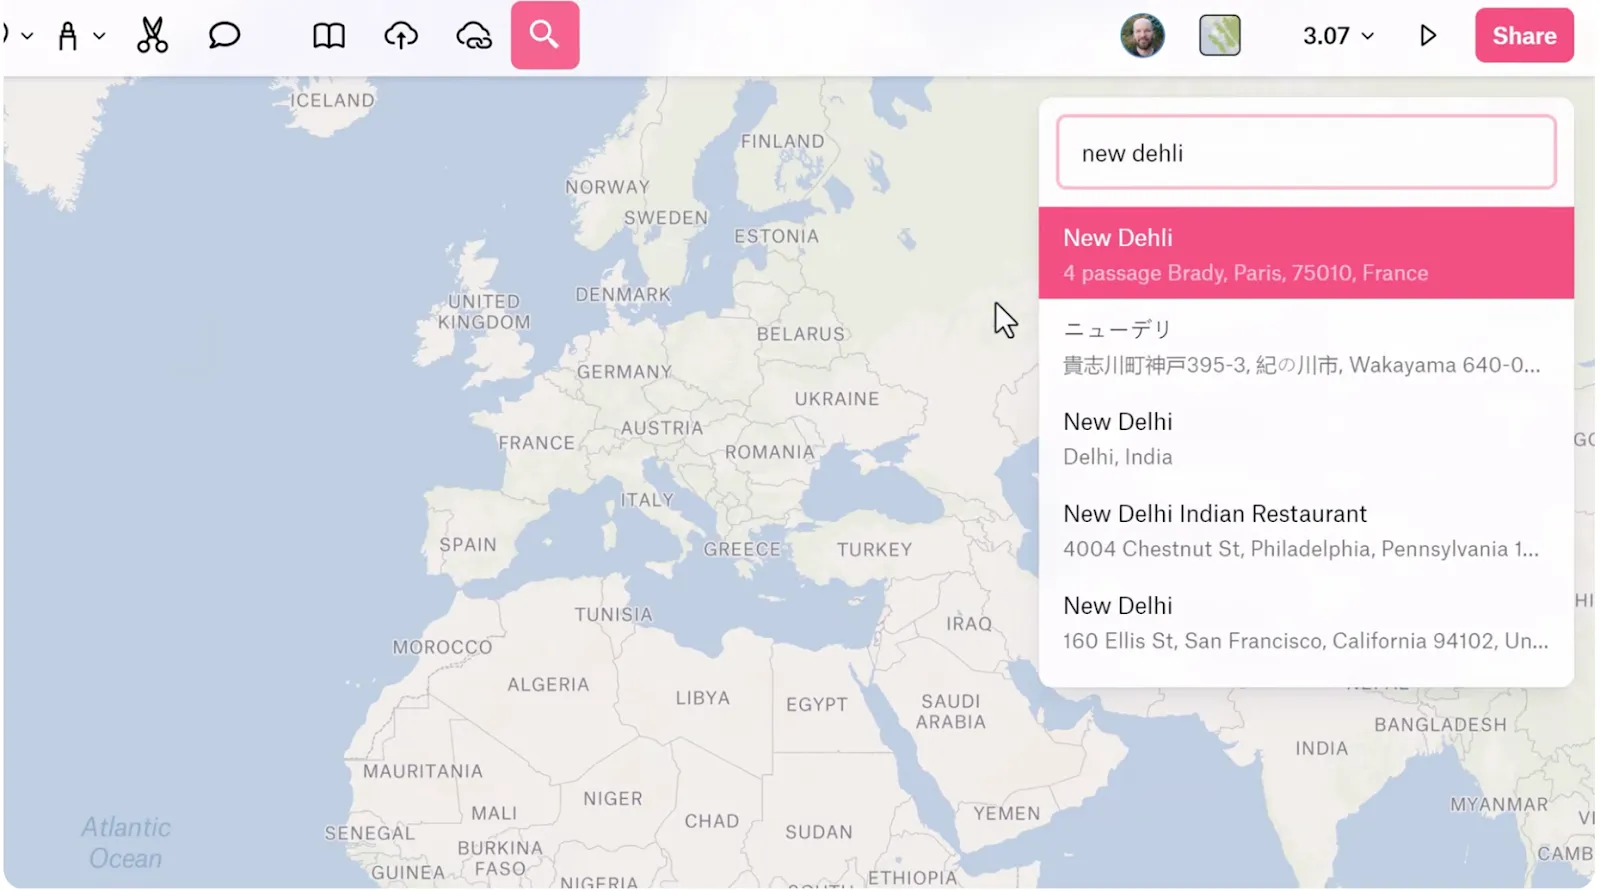
Search bar and pins
Look up places and addresses in Felt and drop pins exactly where you need them. Pins tie to real-world coordinates, so your map is easy to update.
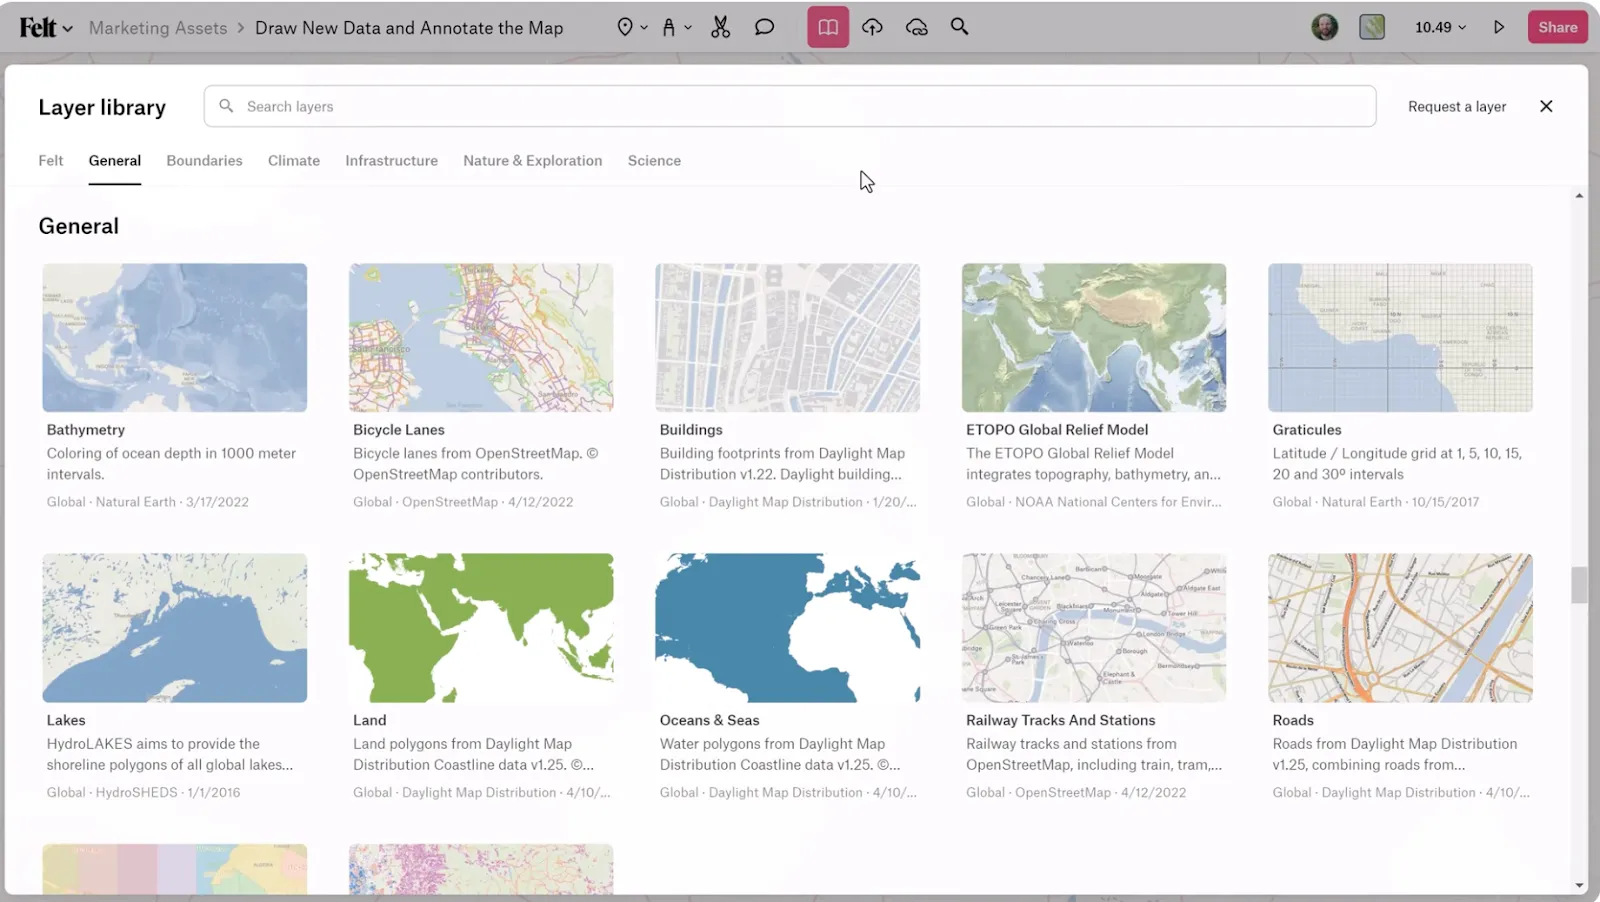
Layer library context
Bring your maps to life by adding administrative boundaries, terrain details, and infrastructure information straight from the Felt layer library.
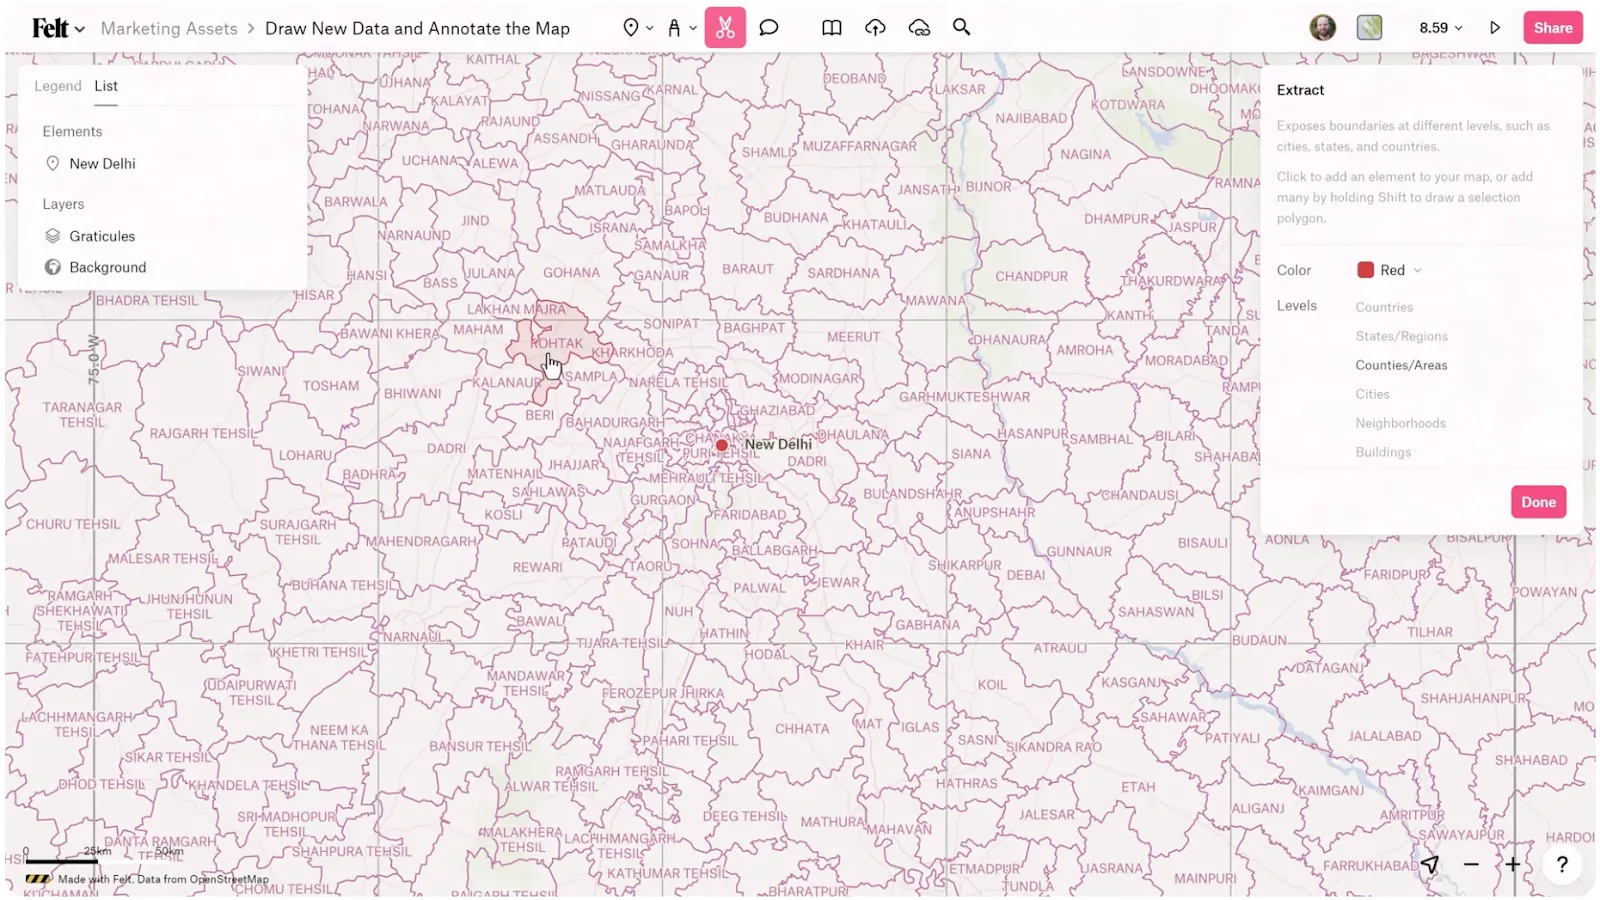
Extract tool for boundaries
Pull in accurate boundaries for cities, counties, and states. Instead of manually tracing shapes, you work with real geometry for greater consistency.
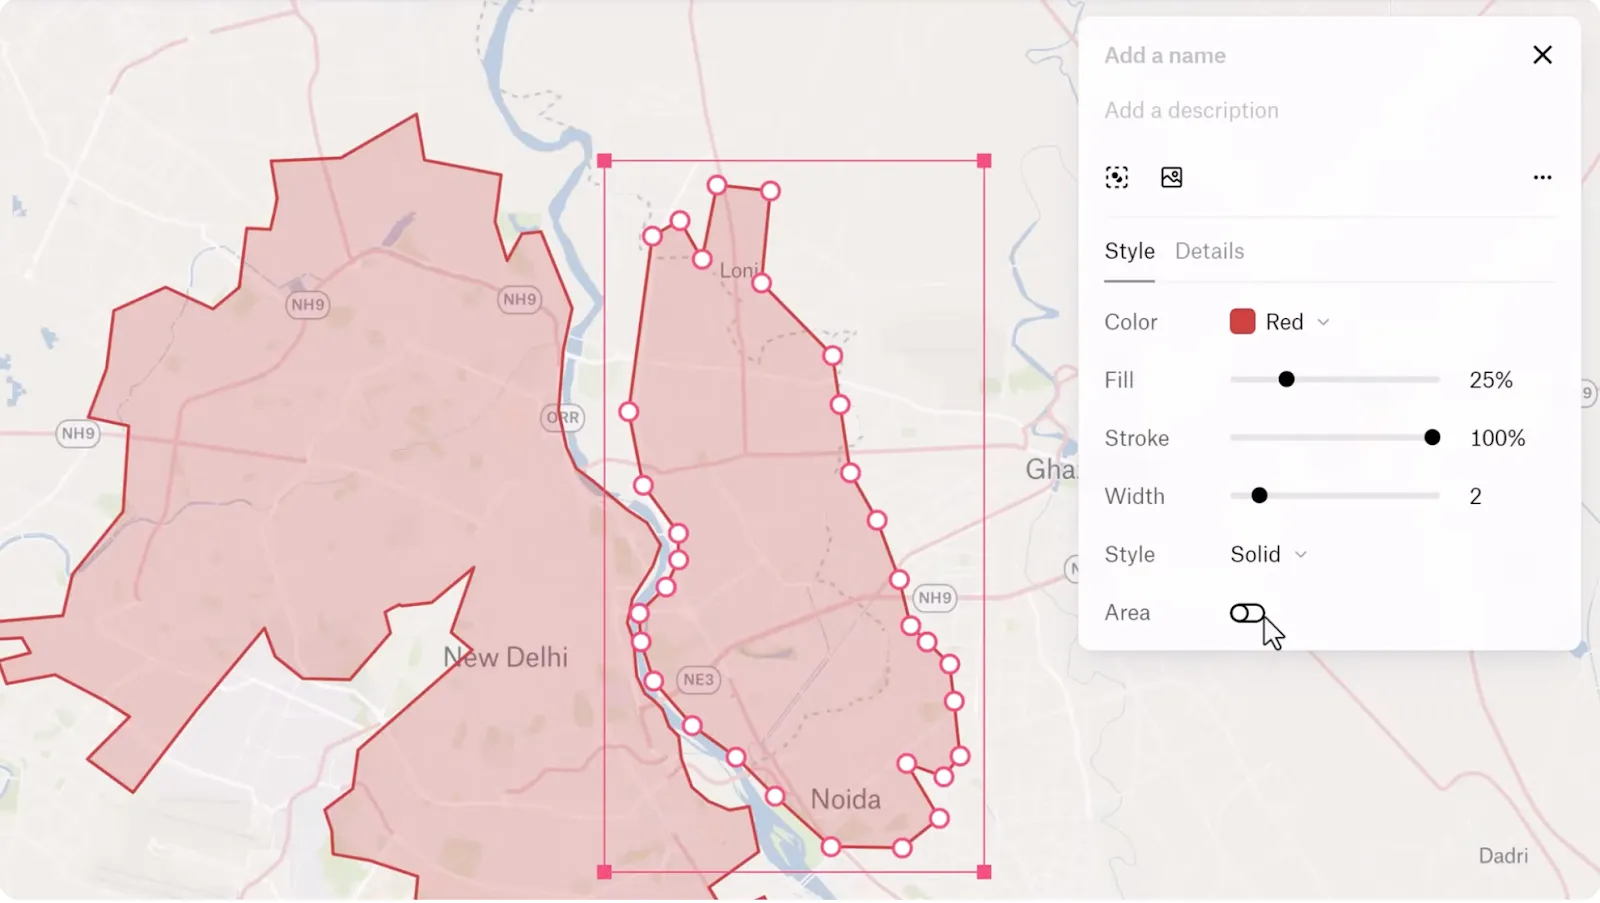
Polygon tool
Draw precise polygons that highlight specific areas, define regions, and help you visualize coverage. Since they’re geometry-based, these shapes are more editable and reusable than freehand drawings found in less specialized software.
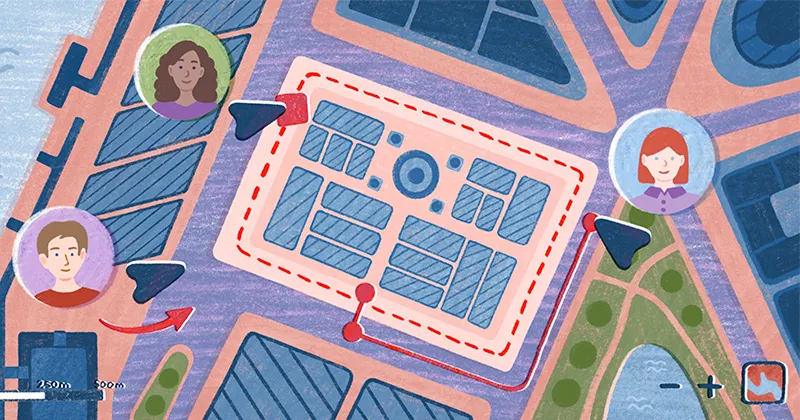
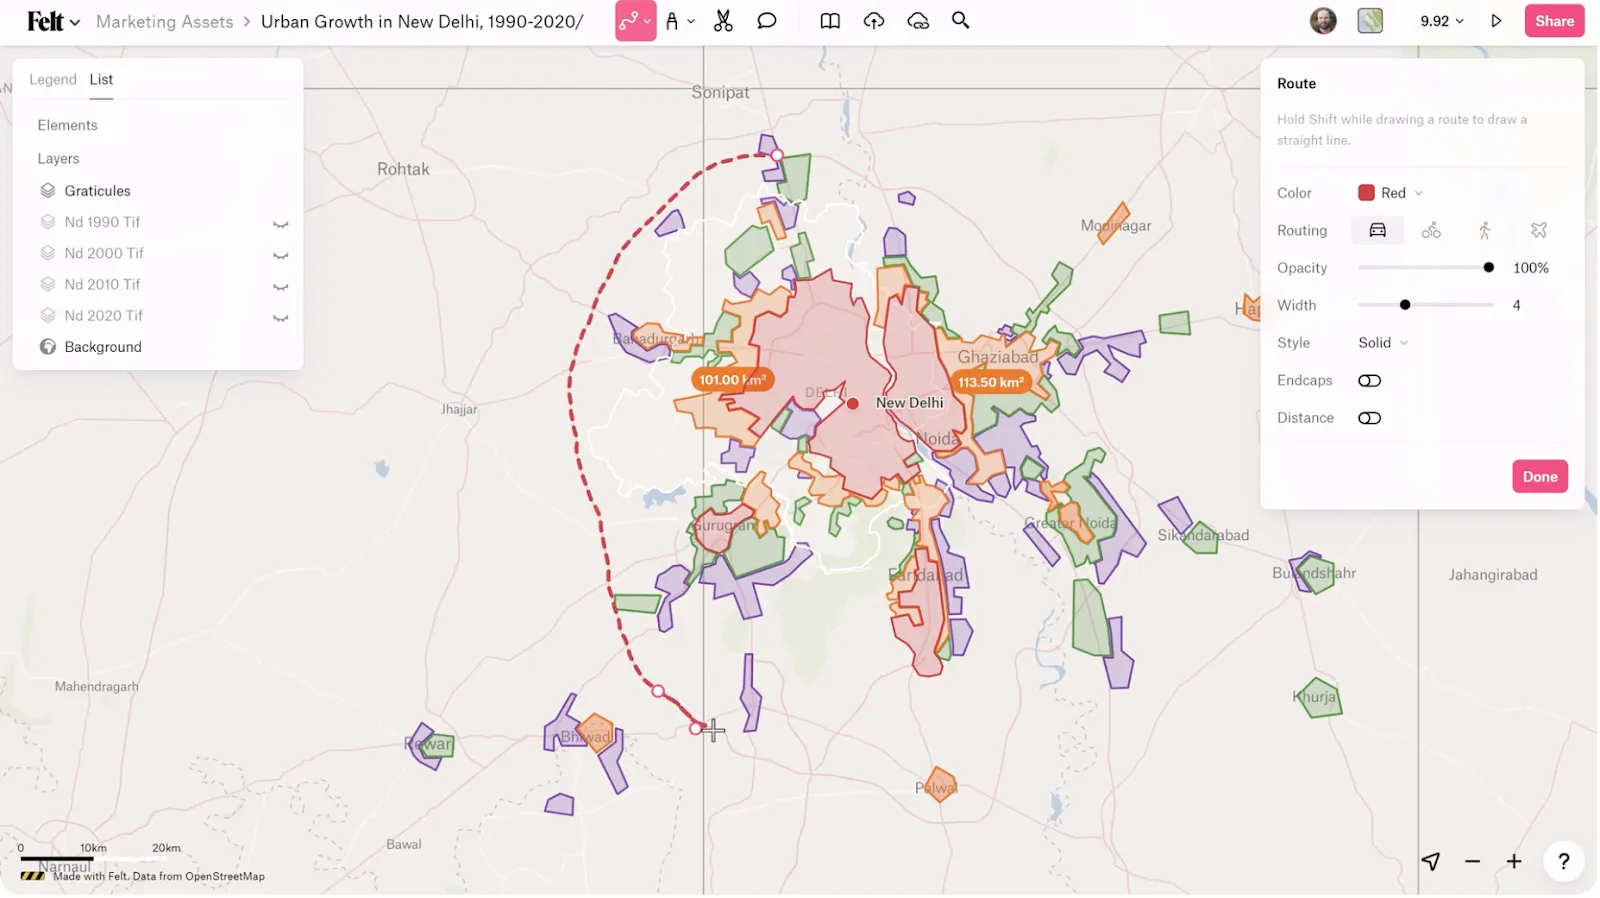
Route tool
Effortlessly visualize travel, logistics, and movement. Felt lets you quickly create clean, accurate routes that follow real roads and paths, so you don’t have to manually plot every point.
Keep your drawings organized and convert them into real data
Drawing on a map is only the start — what really matters is how easily you can organize your work and convert sketches into structured GIS data. The following features from Felt help you move from simple drawings to layers that support analysis and collaboration.
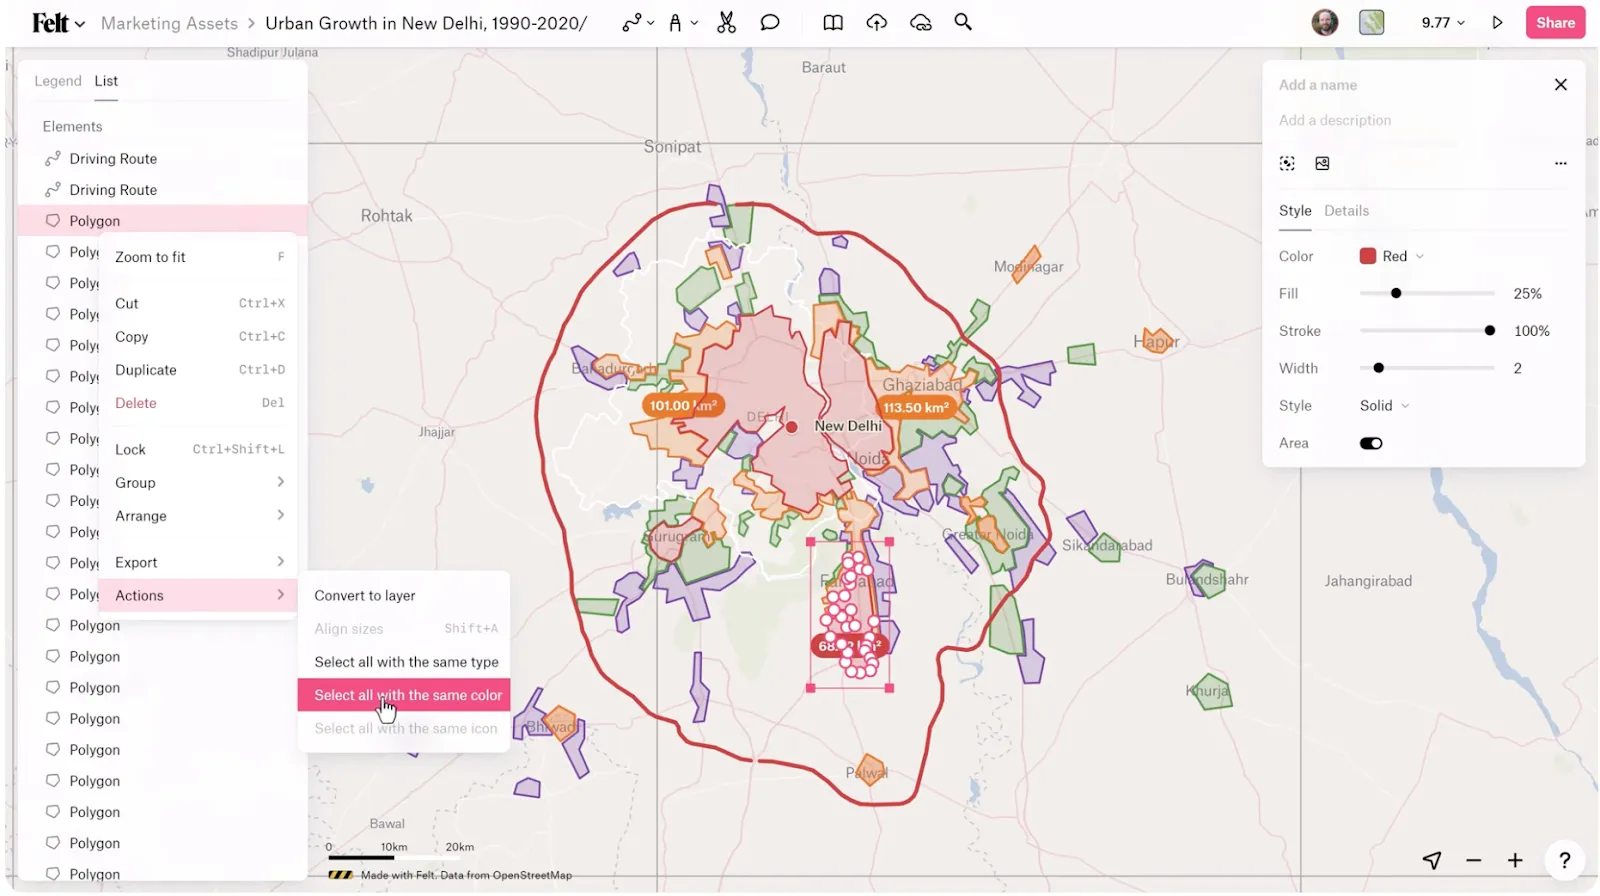
Select by color
Instantly select all markers, lines, or shapes that share the same color. Felt allows you to edit and style similar drawings in seconds minus the manual clicking.
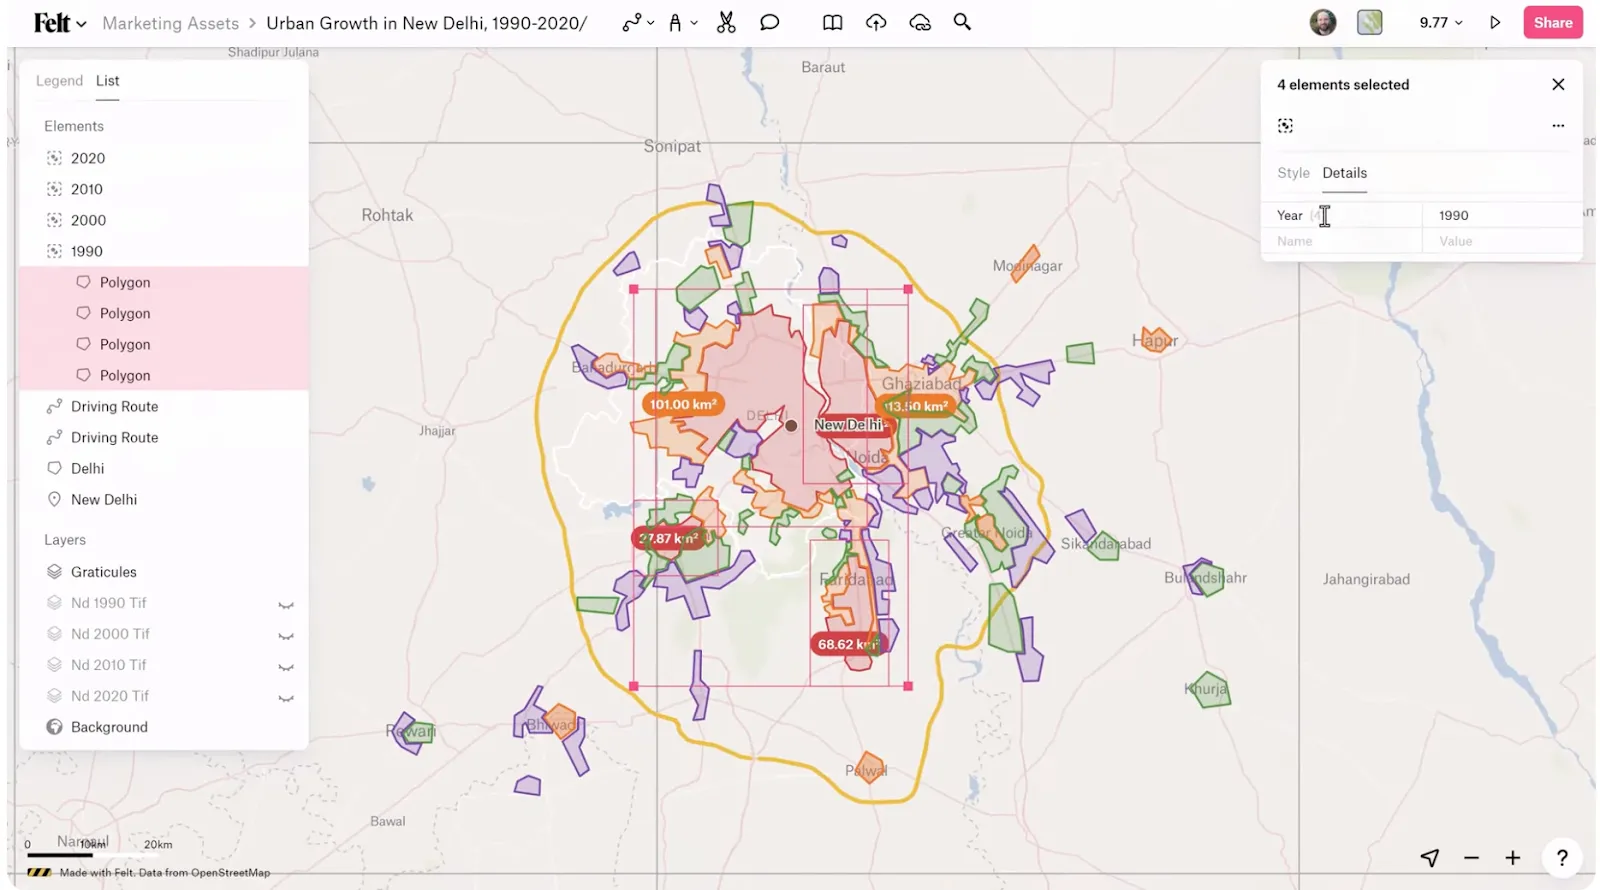
Add attributes
Attach custom attributes to your drawings to add context, labels, or data points. Your markers become rich, collaborative elements instead of static pins.
Convert to a layer
With one click, convert your drawings into a proper data layer. Then you can analyze and share these drawings without losing accuracy or structure.
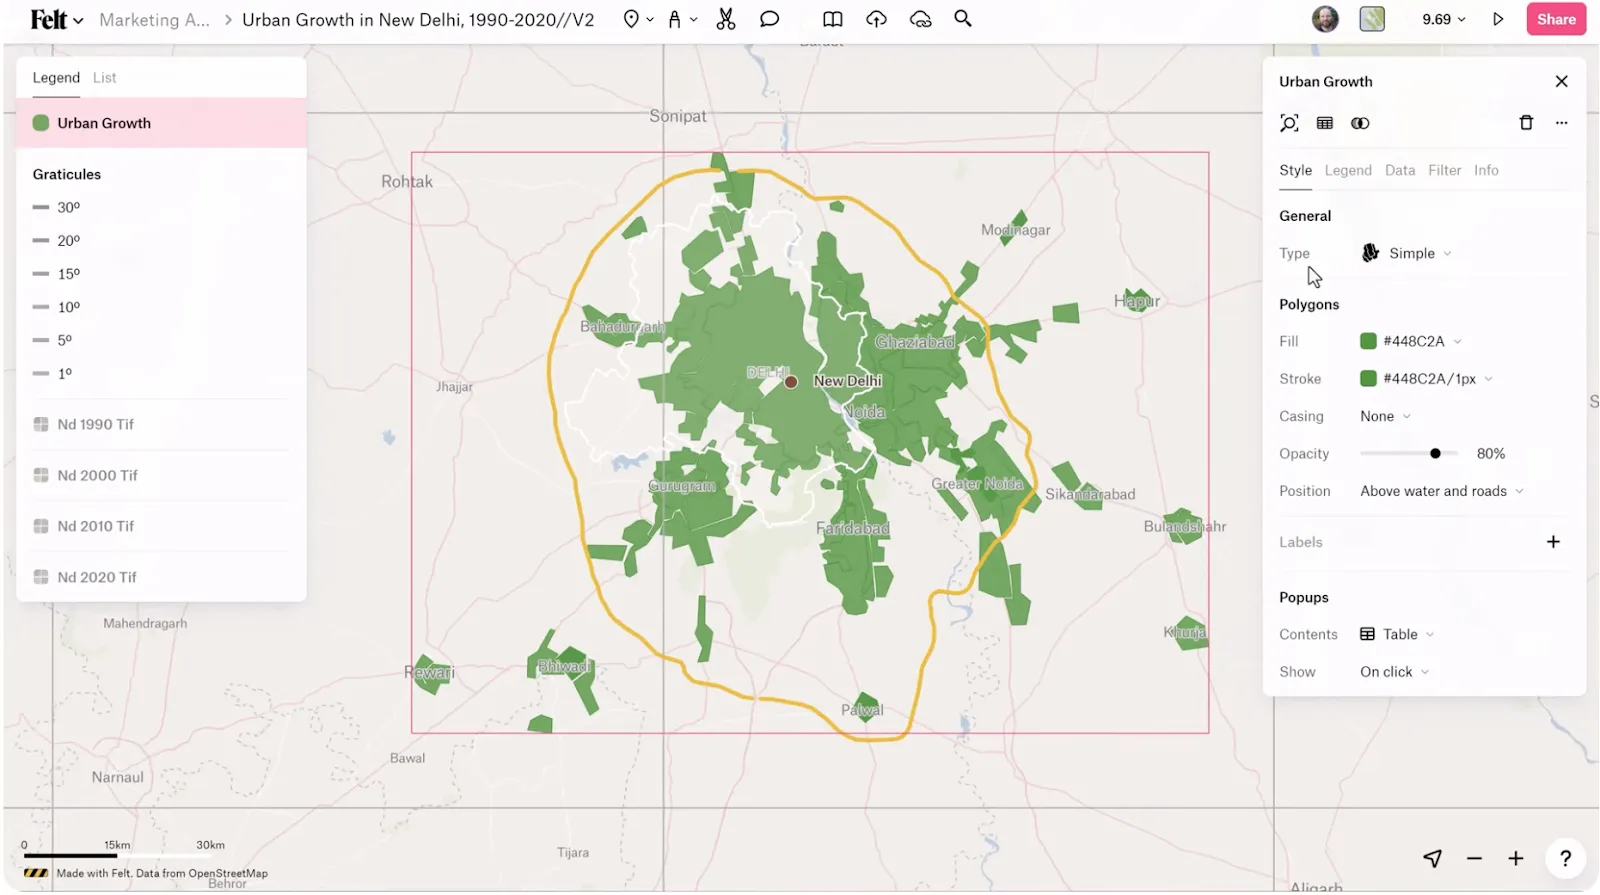
By transitioning from freeform drawings to organized layers, Felt helps you build maps that are not only visually polished but also ready for real analysis.
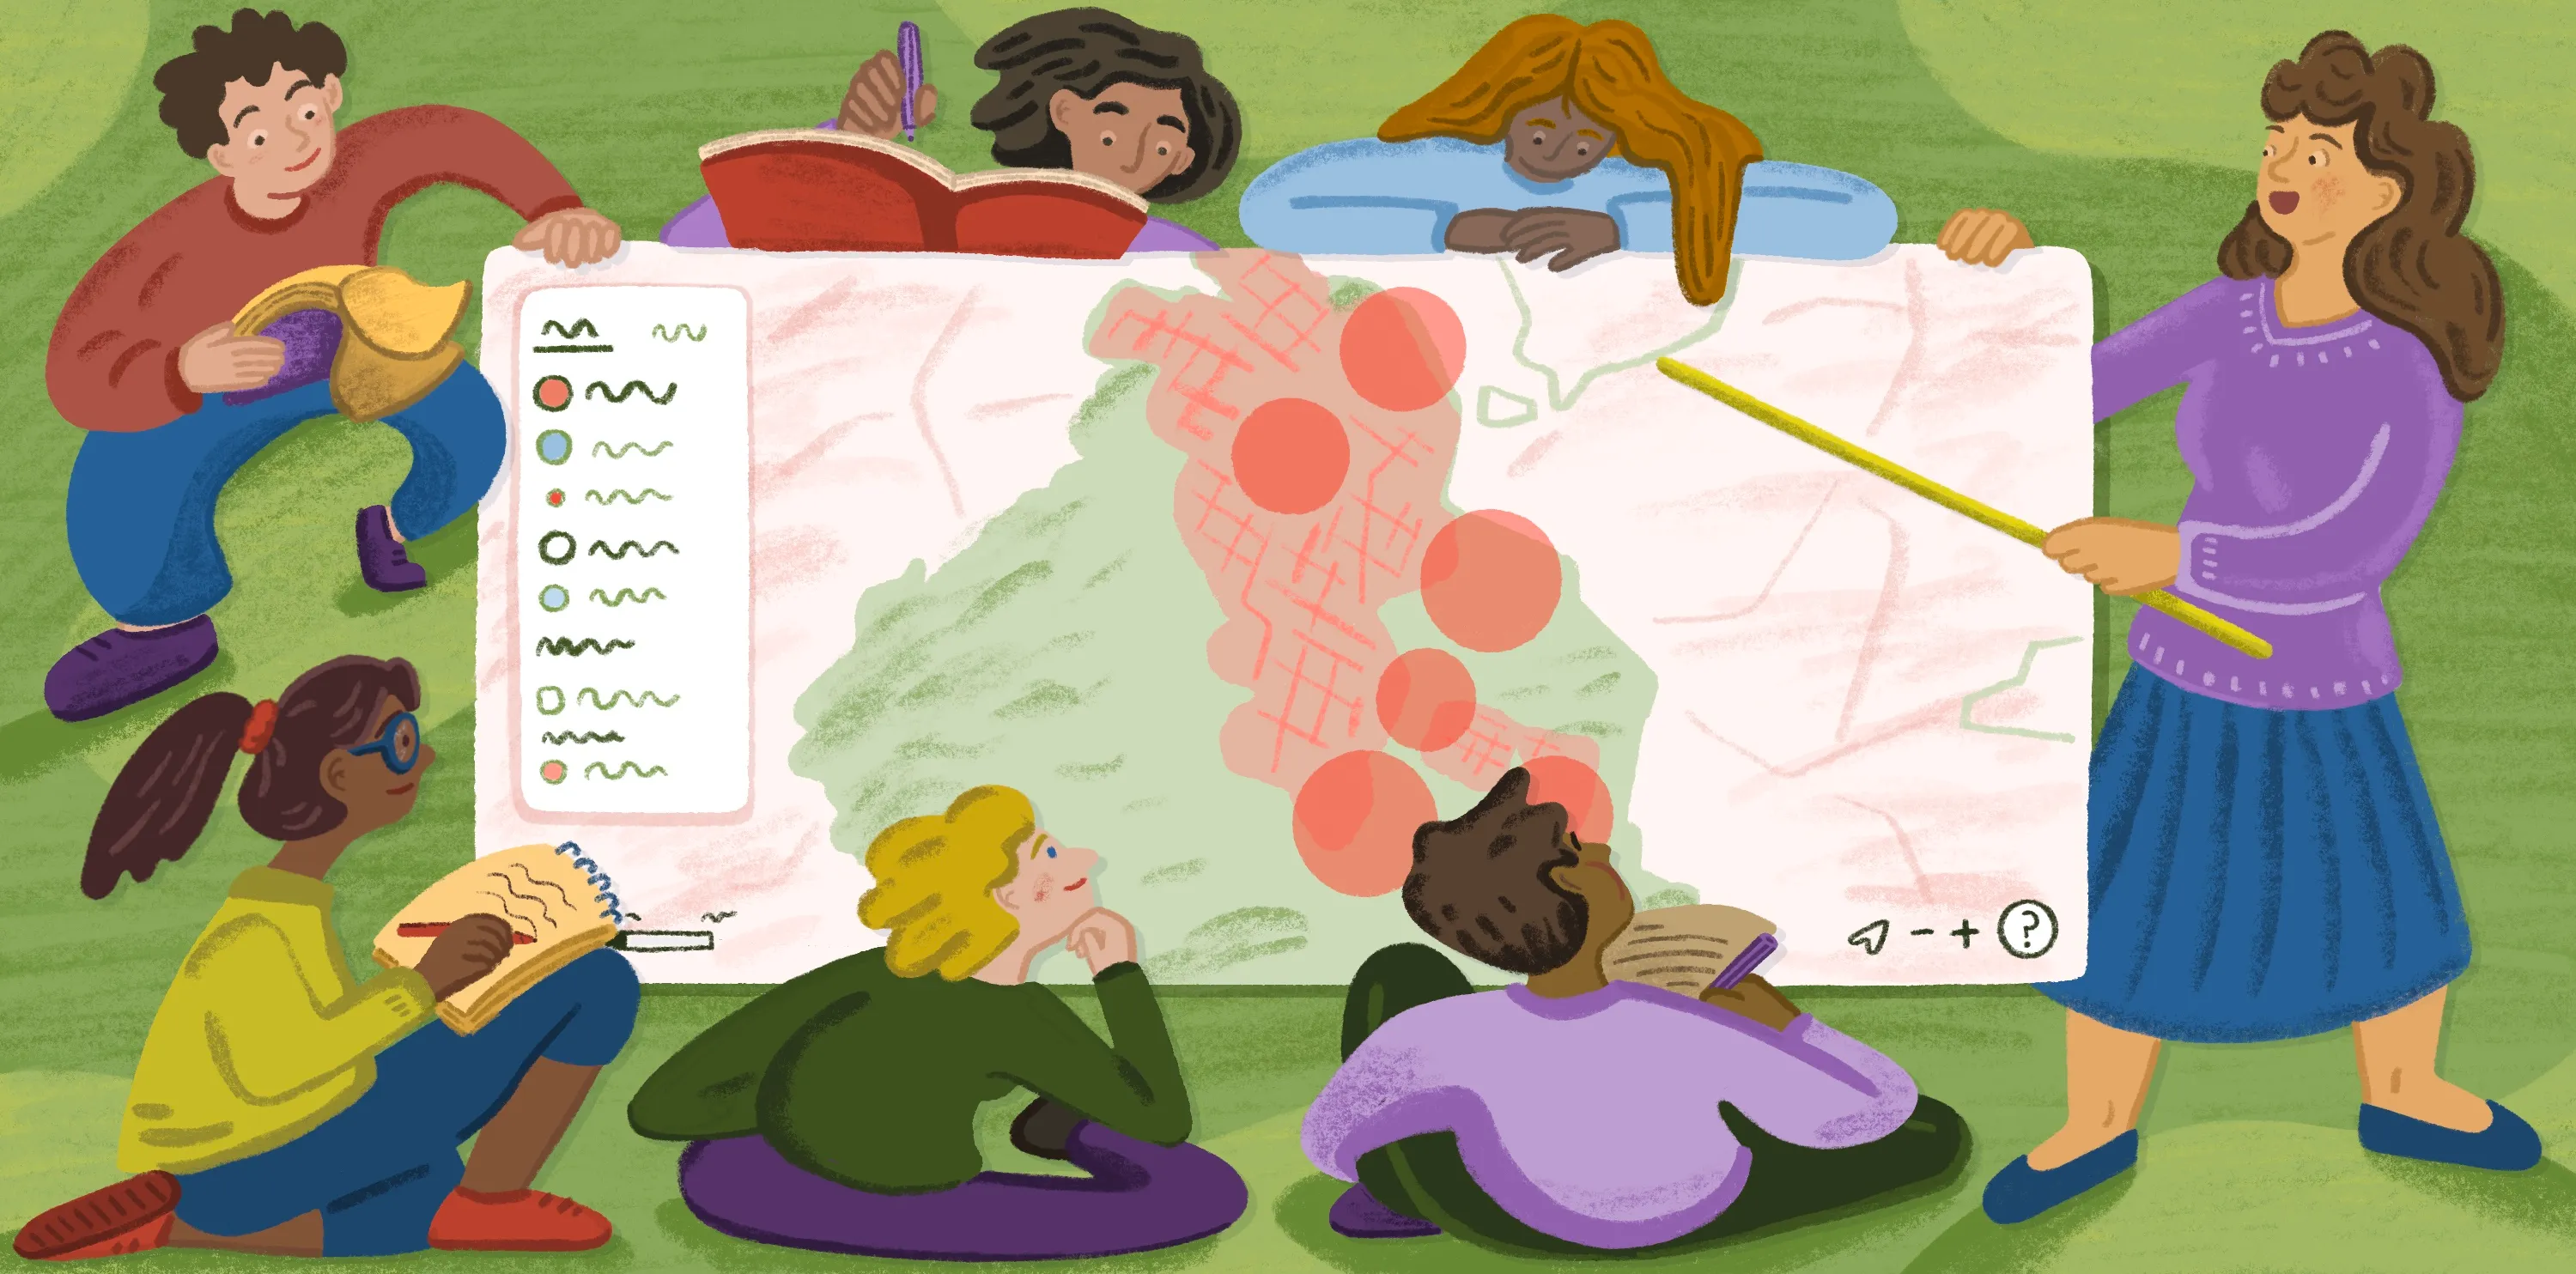
Style your map so it’s readable at a glance
The difference between a map that’s easy to read and one that’s cluttered or confusing comes down to effective symbology, thoughtful color choices, and consistent styling.
While Google Maps applies default styles automatically, those styles leave little room for the nuance or emphasis needed for detailed mapmaking. By contrast, Felt’s map editor gives you total control so you can call attention to important details and make your map understandable at a glance. Here’s how.
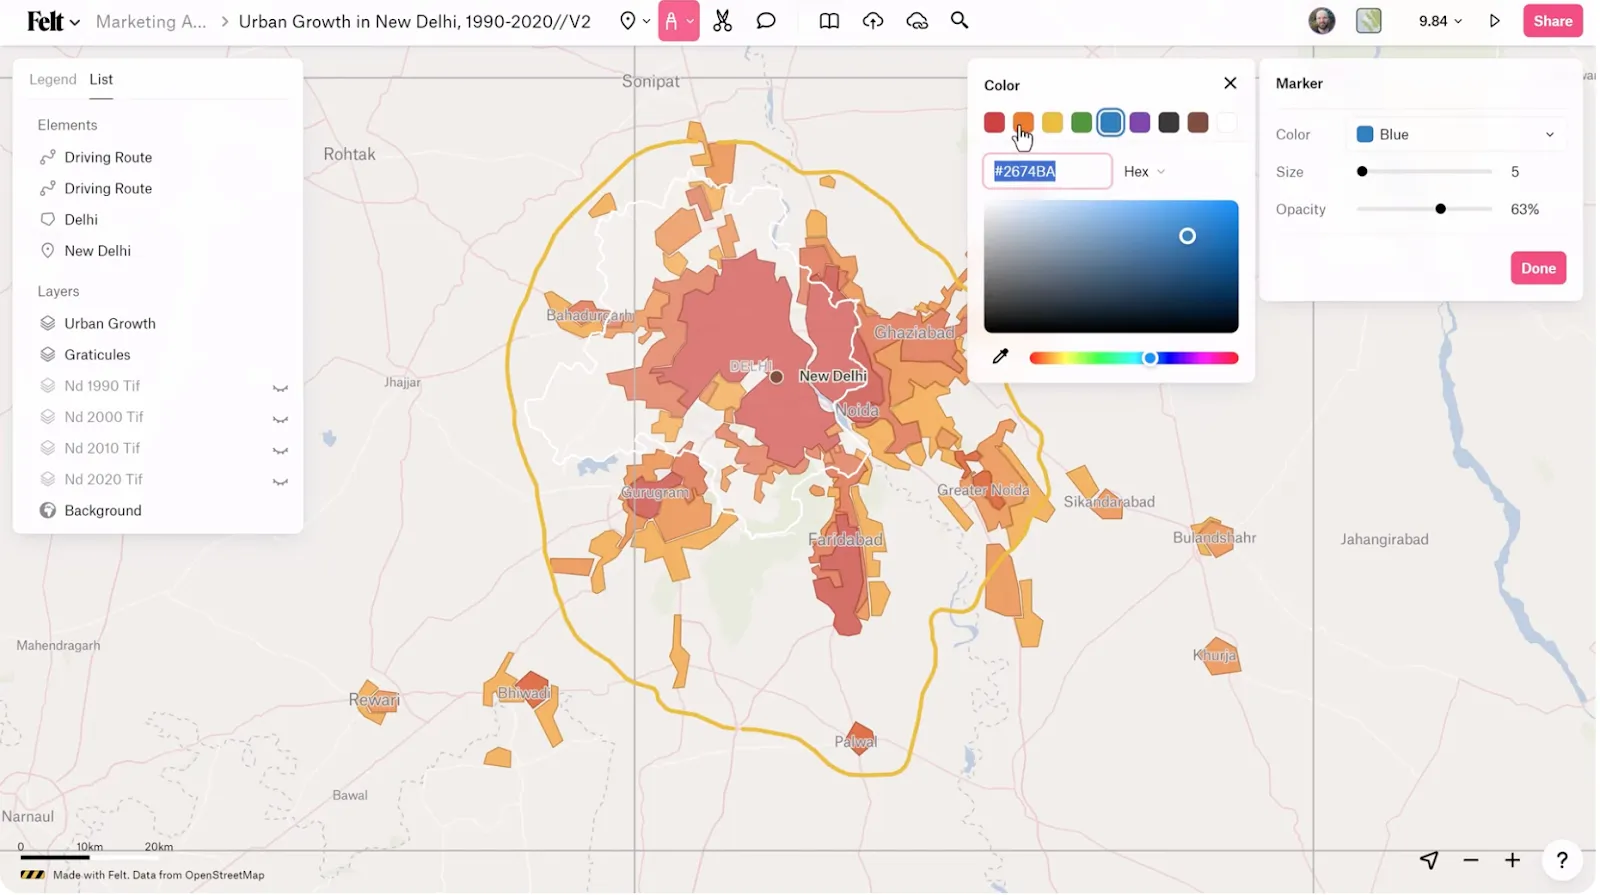
Vector styling
Vector styling transforms simple points, lines, and shapes into a map you can actually understand. With Felt, you can easily adjust colors and line thickness to create a visual hierarchy, helping your eye naturally focus on the most important information.
Whether you’re making specific routes pop or emphasizing the boundaries of an area, vector styling ensures your map tells a clear and engaging story.
Raster styling
Raster styling gives you control over imagery and continuous data such as satellite basemaps and heat-style layers. In Felt, you can fine-tune contrast and color ramps to add context without overpowering your vector data. This makes it easier to layer information and maintain readability even as your map becomes more complex and detailed.
Annotate, collaborate, and export your work
Once your map is drawn and styled, annotations reveal the story behind the data. Collaboration makes that story even stronger. Here’s a look at Felt’s annotation and sharing tools, which help you communicate what the map represents, collect team feedback, and move seamlessly from draft to final output.
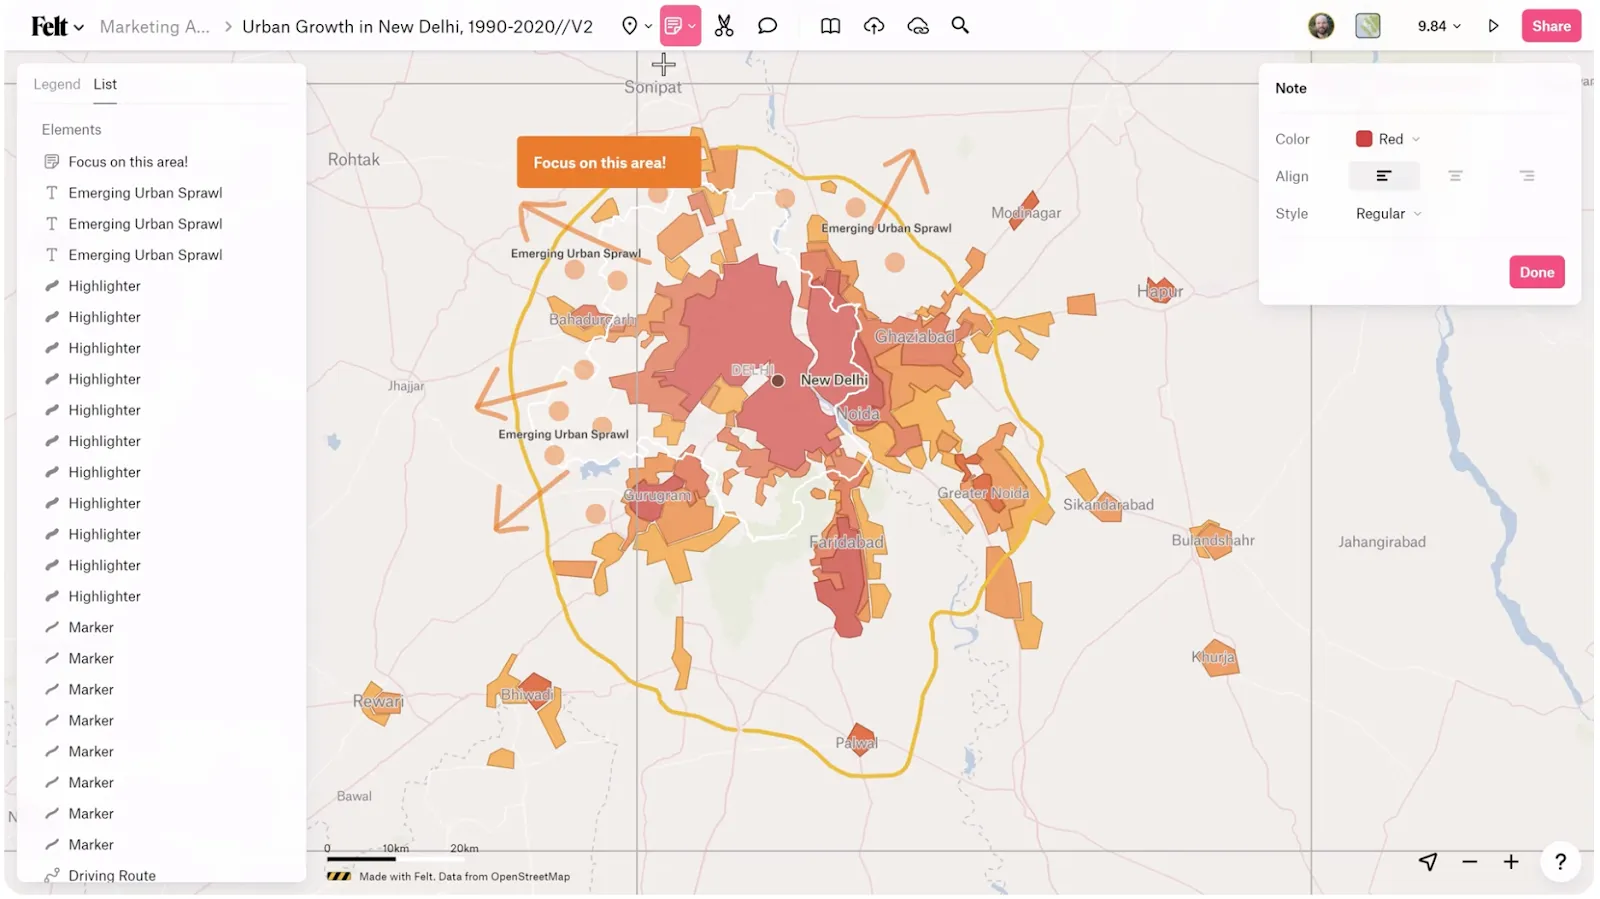
Markers and highlighters
Use markers and highlighters to call out key locations or areas quickly. These tools focus attention without permanently altering your data.
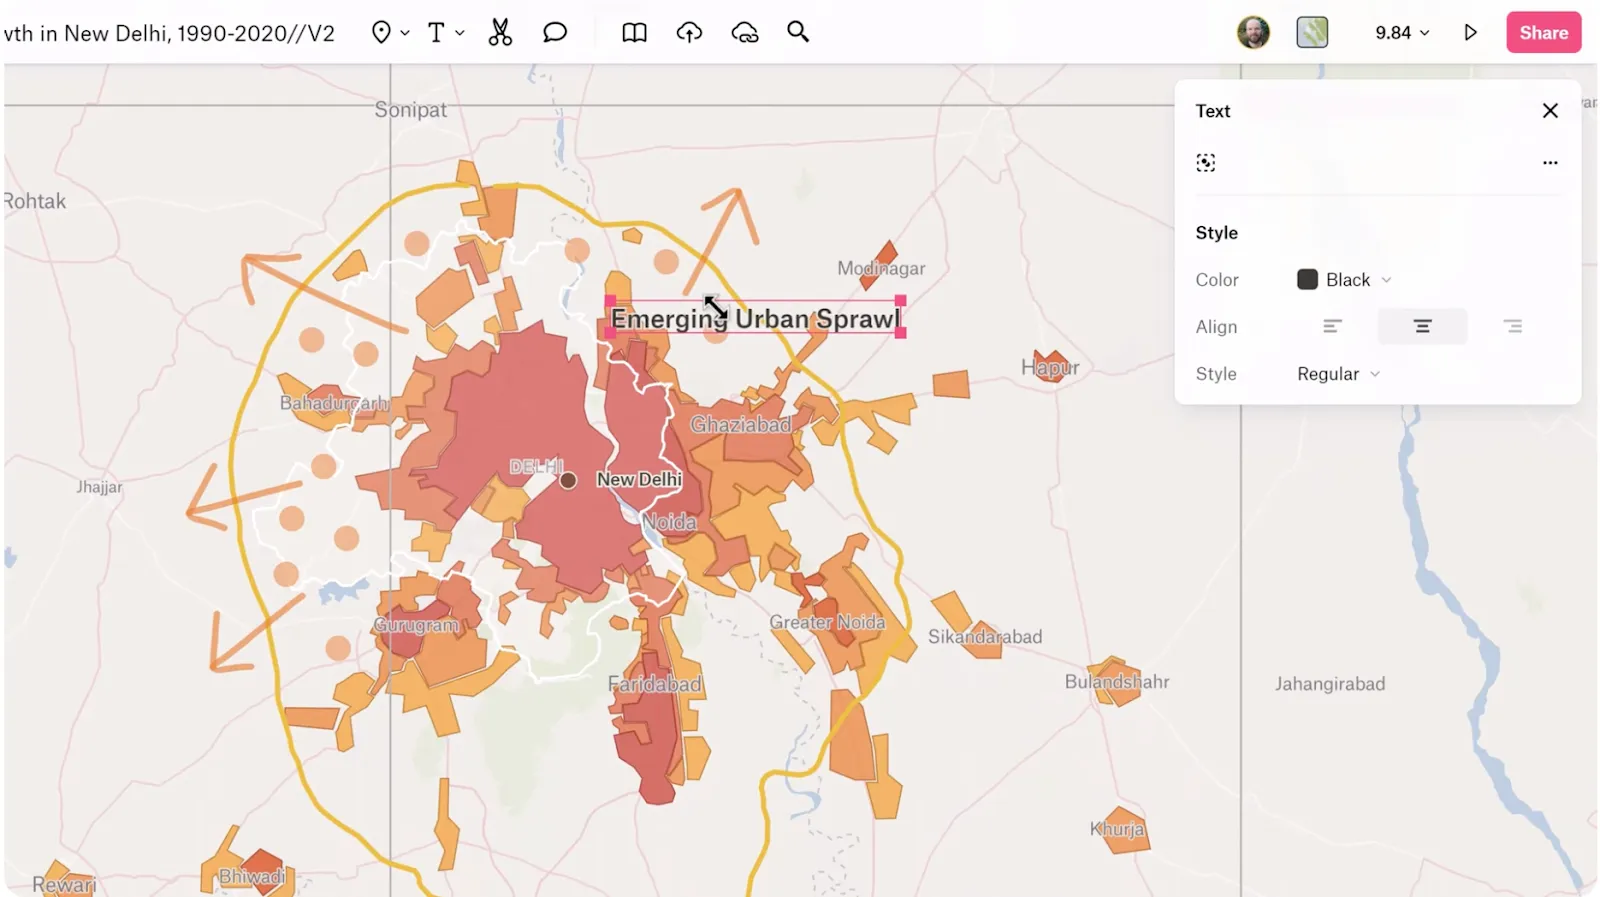
Text tool
Add on-map text to explain patterns or guide readers. Labels help viewers understand the data and reduce the need to reference other documents.
Notes and comments
Write notes in the map explaining decisions and asking for feedback. When conversations are anchored to your map, it’s easier to track ideas because they’re not scattered across messages and emails.
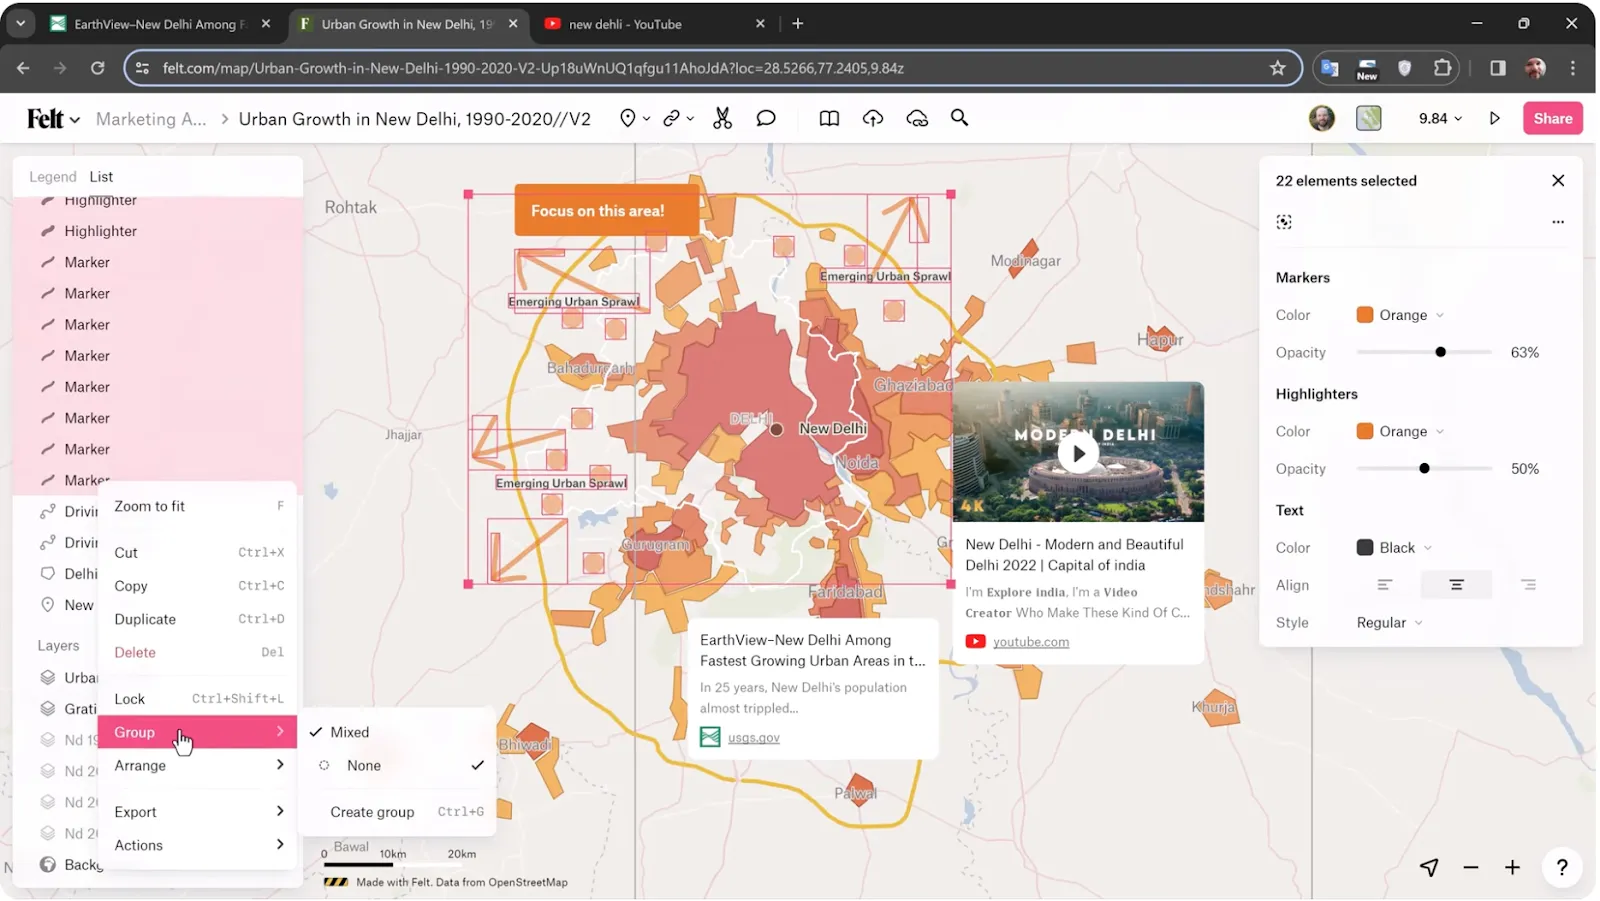
Group annotations
Organize related annotations so you can manage them as a set. Group annotations also help control visibility and keep complex maps easy to navigate.
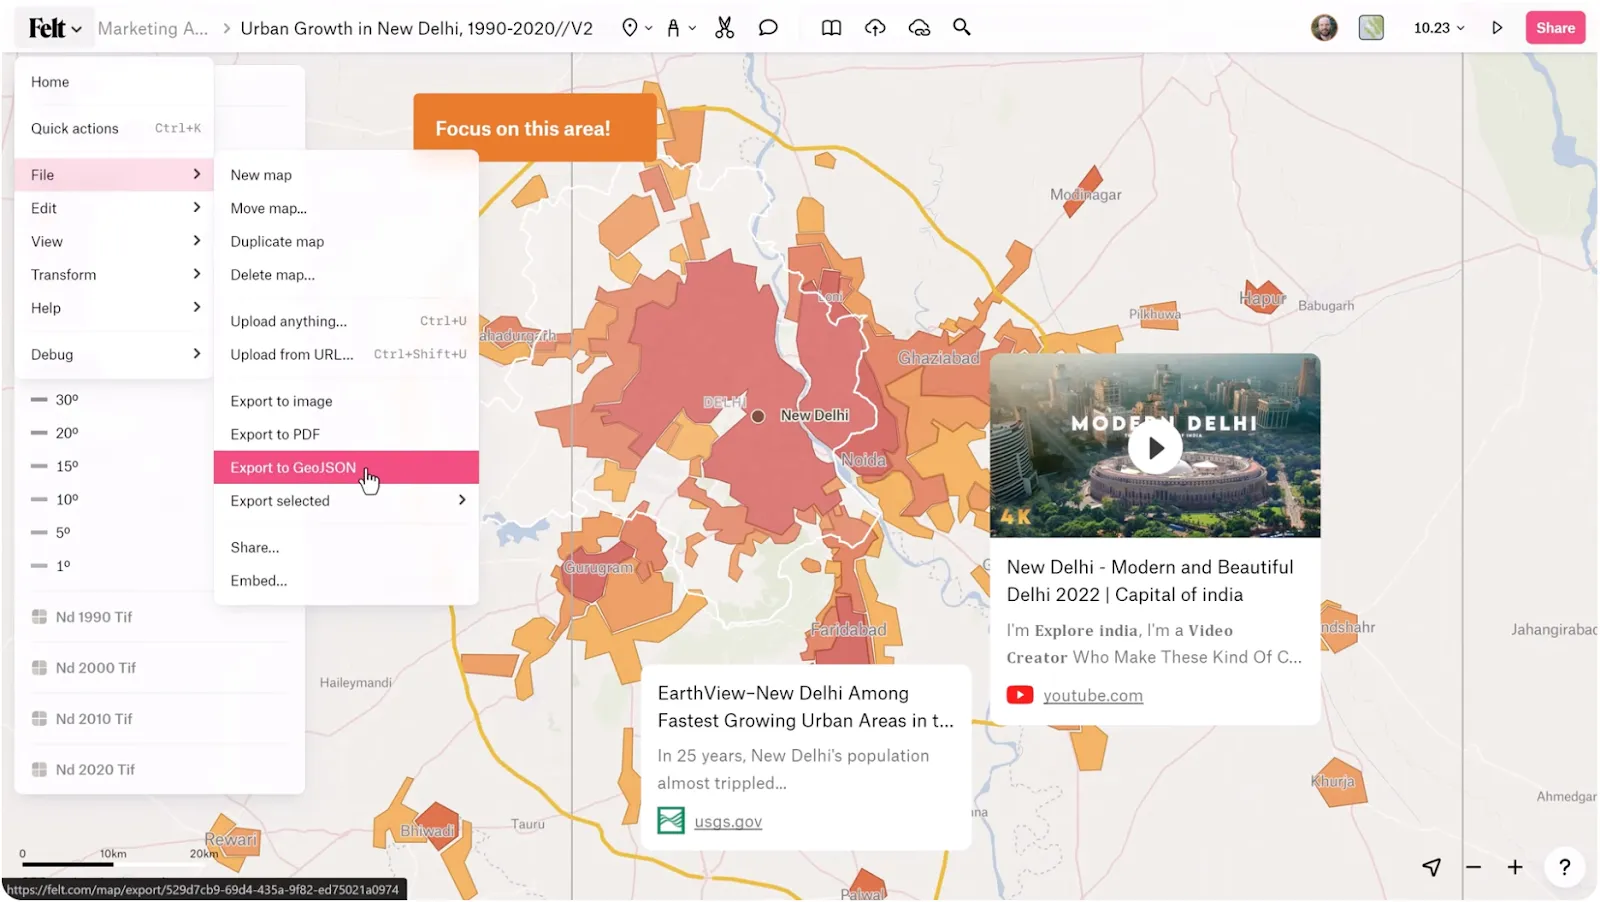
Exporting data
Move your map outside Felt when you want to collaborate more broadly, such as for presenting insights or reusing your work in different tools.
In short, Felt turns maps into a shared workspace that supports better communication and more confident decision making.
Create interactive maps online with Felt
Felt removes friction from map creation thanks to tools that are intuitive, flexible, and fast. The platform makes the process easy so you don’t need to fight default settings or stitch together workarounds to get the map you want.
Ready to move beyond static visuals and clunky drawing tools with no coding required? Start building your next map in Felt and see how easy it is to turn ideas and data into something your whole team can understand.
Compare Felt using AI


.jpg)