How to create a property site map: Use cases and guide
Learn what a property site map is and how to create and analyze site plans with GIS software.

Discover what a property site map is and what it includes. Learn how to create and analyze site plans with GIS software and mapping tools.
Before you can assess a site’s potential, you need to understand how the land works: where the access points are, what might limit construction, and how the surrounding area affects the project.
A property site map answers those questions by turning those separate sources of information into a clear spatial view. But by the time you collect and compare data from multiple sources and put it on a map, it may already be outdated. A static map is also difficult to distribute and share.
That’s why site mapping is moving toward more interactive, data-driven workflows. In this guide, you’ll learn what a property site map is, when you’ll need one, and how to create your own.
Site maps: Definition and types
A property site map is a visual representation of land showing infrastructure, access points, and immediate surroundings. In geographic information systems (GIS), a property site map provides a shared view of the site, helping teams understand current conditions and evaluate its building potential.
Site maps are also a planning and compliance document. Professionals like real estate developers, urban planners, and engineers use property site maps to check whether a project:
- Fits zoning rules
- Meets access requirements
- Avoids risks and constraints
- Supports safe, practical development
While these maps are always decision-making tools, different types help unique use cases. Let’s take a look at the two most common styles.
2D site maps
A 2D property site map shows a property from a top-down view. It’s common in planning reviews and early feasibility studies because it shows boundaries, access points, and site features in relation to one another.
For example, an urban developer can use a 2D site map to show a proposed mall parking lot area when submitting a planning application.
3D site maps
A 3D site map adds depth, height, and terrain contours to a property. It helps you understand how landscapes and nearby geographic features may look and interact in the real world.
An architect, for example, can use a 3D site map to show how a building would sit on a sloped parcel and how it might affect views or shadows from different directions.
What does a property site map include?
A property site map typically includes:
- Property boundaries and setbacks: Boundaries show a parcel’s legal outline, while setbacks show how far it should sit from property lines, roads, and waterways.
- Existing and proposed structures: Site maps can show existing buildings alongside planned additions, new construction, and parking areas. Seeing current and proposed conditions in one view helps you understand what’s changing in the area and whether the additions fit.
- Access points: Entry routes like roads, driveways, and gates show how people and vehicles move through a property. This tells you where to place buildings, letting you consider factors like emergency and construction vehicle clearance.
- Utilities: Site maps provide information on utility details, like water, electricity, and drainage. This data lets you plan real estate and avoid infrastructure damage.
- Landscaping and terrain: Maps let you study natural features, such as trees and vegetation, because they influence site development. For example, slopes or erosion could make nearby properties unsuitable for construction.
When do you need a property site map? Real use cases
Countless professionals use property site maps to arrange, access, or regulate land. Here are a few scenarios where you’d need one.
Applying for building permits
Permit applications require a site plan that shows where the proposed work will take place. Local authorities need to confirm that a new building, driveway, or utility connection meets setback rules and doesn’t overlap with neighboring plots.
Renovations or additions
Site maps help when a property owner or developer wants to change an existing plot. Additions can impact features beyond the building itself, and many local areas require authorization before work takes place. For example, a homeowner planning an extension may need to show how their new guest house sits within allowable boundaries.
Property development projects
You can use site maps early in the planning process to understand project feasibility. The map becomes a working view of the site, so you can compare pros and cons before committing to a design.
For a multifamily project, a site map can show where houses, parking, and open space fit. For a retail site, it reveals road access and how the surrounding areas support the proposal. In both cases, the site map turns a parcel into a concrete development strategy you can share with stakeholders.
Zoning and compliance reviews
Site maps compare a proposed use case against local rules, such as height limits, protected areas, or potential flood zones. Instead of reviewing each constraint separately, you can use a map to visually analyze how a rule affects the site in context.
For instance, take this interactive map showing properties in Hartford, Connecticut:
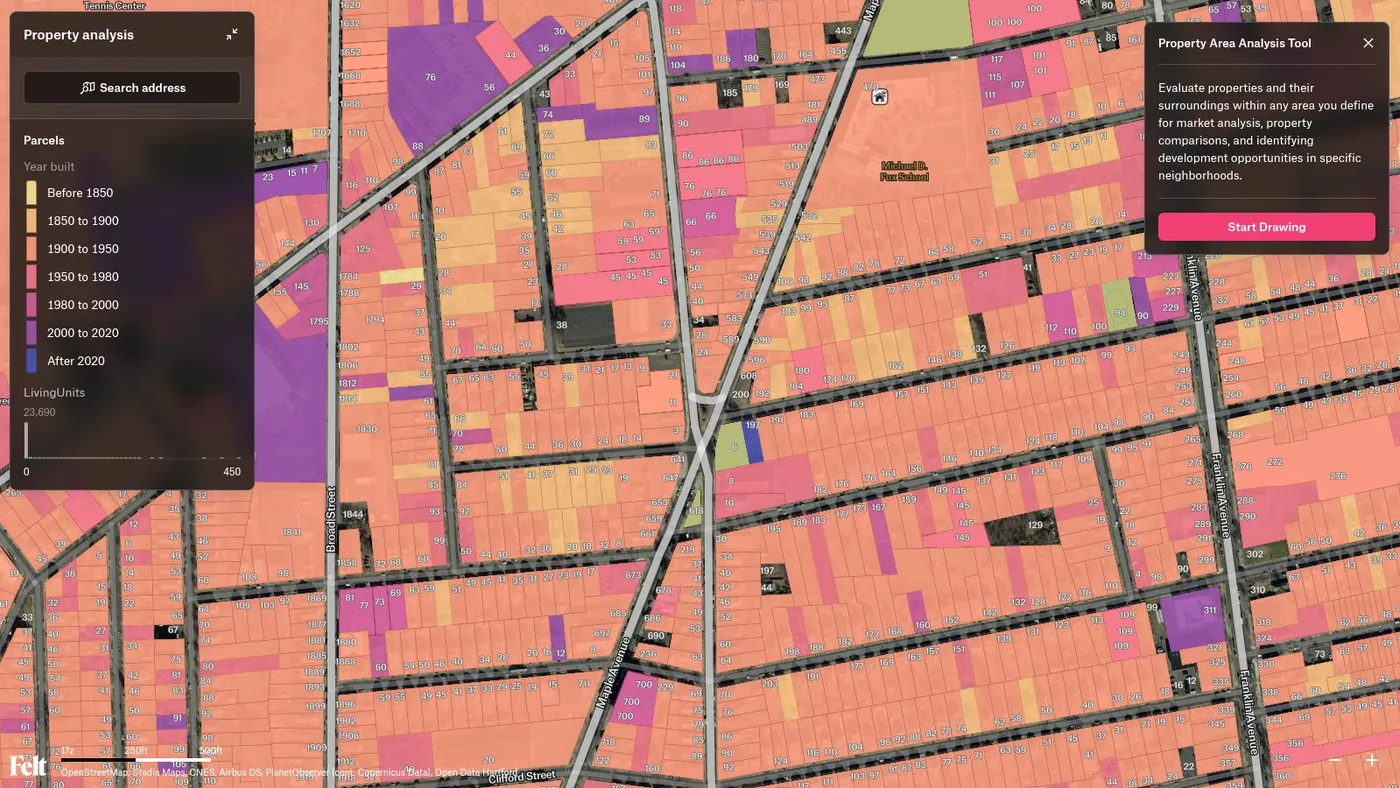
This site map was built in Felt, and it provides dozens of data points at a glance. Viewers can study sale history, year built, and zoning codes by clicking on individual properties.
How to create a property site map in 5 steps
Most people don’t simply obtain a property site plan — they design one, incorporating multiple data layers. And anyone can do it with the right know-how and tools. Here’s how to make a site plan map in five steps.
Pro tip: You can use these steps manually, or use modern property mapping software to organize each dataset from all the below criteria. GIS software like Felt makes it easy to add data, layer it, and instantly share the results with a link.
1. Gather property and parcel data
Collect records that describe the property, including:
- The property deed
- Parcel maps or plat maps
- Land records from the county recorder
- Previous surveys
- Assessor records, including assessed values
- Available property planning reports
At this stage, treat each source as part of the larger picture. For example, a survey suits more precise measurements, while a parcel viewer helps with initial orientation.
Keep in mind that you can often obtain most of these documents for free. Property site plans often use publicly available information from local government offices.
2. Identify boundaries and measurements
Next, define the property’s lines and measurements. Apart from the boundary and lot dimensions, check whether nearby areas have development restrictions. A site may look large enough for your proposed structure, but setbacks can significantly reduce the buildable area. Mapping any limitations early helps you prioritize time, energy, and resources in the project.
3. Map existing structures and features
Now, add the site’s existing physical features that might affect how it functions. Map out:
- Existing buildings
- Parking areas
- Garages and driveways
- Fences
- Walls
- Drainage features
- Trees
- Natural factors like slopes and terrain
Then, add any proposed changes in a separate layer to keep differences distinct and the map easier to view. It helps with comparisons, especially for non-technical viewers.
4. Add utilities and access points
In terms of functionality, a site map should show how various demographic groups and services access through the area. Be sure to add:
- Roads
- Driveways
- Sidewalks
- Gates and other entrances
- Parking access
- Emergency routes
Utilities like water, electricity, and drainage systems also influence a project’s feasibility. Incorporate these elements to see if underground lines interfere with the proposed area.
5. Include zoning and regulatory constraints
Lastly, add the rules and restrictions that govern land use in the area, including:
- Zoning districts
- Parking requirements
- Flood zones
- Environmental buffer zones
- Conservation areas
- Land-use overlays
Once you compile this data into an interactive map, you can examine features individually or compare the relationships between them. GIS makes site analysis straightforward: Toggle data on and off, invite collaborators, and leave on-map comments to gather real-time feedback.
Common challenges in creating site maps
Even if you understand a site well on the ground, turning it into a reliable property map can be challenging. Here are a few obstacles to consider:
- Incomplete or outdated data: Older surveys, outdated online maps, and public land records might not reflect recent changes. Compare sources with current field observations before moving to the planning phase.
- Manual and time-consuming workflows: Site mapping might require tracing boundaries, checking measurements, and moving information between tools. Without a GIS, each manual step adds time and increases the risk of human error.
- Difficulty updating static plans: Static drawings and PDFs work for one-time or final submissions, but site plans change often. Different people may revise layouts or respond to feedback, leading to more outdated content.
- Limited visibility across teams: Everyone involved in a project needs the same site context. When property information is scattered across files or different systems, it becomes harder to review plans.
Use GIS to improve property site mapping decisions with Felt
Traditional site maps support permit applications and planning reviews, but they’re more challenging to update when site conditions change or you need to loop in stakeholders.
GIS maps give you a shared, layered view of potential sites, turning them into active planning tools. In Felt’s cloud-native GIS platform, you can combine parcel data, zoning constraints, utilities, and field observations in a single live workspace — no desktop installs, no file exports.
You can even use Felt AI to query your parcel data once it’s in Felt and build a custom property map from a prompt.
With interactive layers and filters, spatial analysis becomes easier to share with stakeholders: toggle data on and off, leave on-map comments, and keep project teams aligned without re-exporting files. You can even extend your reach with Felt’s Field App, which lets teams capture GPS-backed data and geotagged photos, then sync the information to the office.
For enterprise teams, secure workflows like SSO, regional hosting, and VPC deployment let you manage property data across nationwide projects within a single dashboard. The result is property site maps that are easier to create, analyze, and share safely.
Explore our real estate map gallery to see how Felt helps people visualize and understand land. Sign up for free, and turn your own property data into better development decisions.