37° 48' 15.7068'' N, 122° 16' 15.9996'' W
cloud-native gis has arrived
37° 48' 15.7068'' N, 122° 16' 15.9996'' W
cloud-native gis has arrived
37° 48' 15.7068'' N, 122° 16' 15.9996'' W
cloud-native gis has arrived
37° 48' 15.7068'' N, 122° 16' 15.9996'' W
cloud-native gis has arrived
37° 48' 15.7068'' N, 122° 16' 15.9996'' W
cloud-native gis has arrived
37° 48' 15.7068'' N, 122° 16' 15.9996'' W
cloud-native gis has arrived
37° 48' 15.7068'' N, 122° 16' 15.9996'' W
cloud-native gis has arrived
37° 48' 15.7068'' N, 122° 16' 15.9996'' W
cloud-native gis has arrived
37° 48' 15.7068'' N, 122° 16' 15.9996'' W
cloud-native gis has arrived
37° 48' 15.7068'' N, 122° 16' 15.9996'' W
cloud-native gis has arrived
Ask a question. Get a map. The new era of GIS, powered by Felt AI.
Learn more
PLATFORM
Web GIS
Dashboards
Cloud Sources
App Development
Raster
Felt AI
Field App
Industries
agriculture
Cities and Government
CLIMATE and NATURAL RESOURCES
Education
Energy and Utilities
Engineering and Infrastructure
Insurance
Real Estate
Retail
Spatial Intelligence
Telecom
Transportation
Resources
Customers
Webinars
Help Center
Developer Docs
map Gallery
Blog
QGIS Plugin
PRICING
BOOK A
DEMO
Log in
Sign Up
Log in
SIGN UP
Book Demo
Pricing
Product
WEB GIS
Dashboards
Cloud Sources
App Development
Raster
Felt AI
Field App
Industries
agriculture
Cities and Government
CLIMATE AND NATURAL RESOURCES
Education
Energy and Utilities
engineering and infrastructure
Insurance
Real Estate
Retail
Telecom
Transportation
Spatial Intelligence
Resources
Webinars
Help Center
Dev Docs
Map gallery
Customers
BLOG
QGIS Plugin
Data Layer Library
Climate
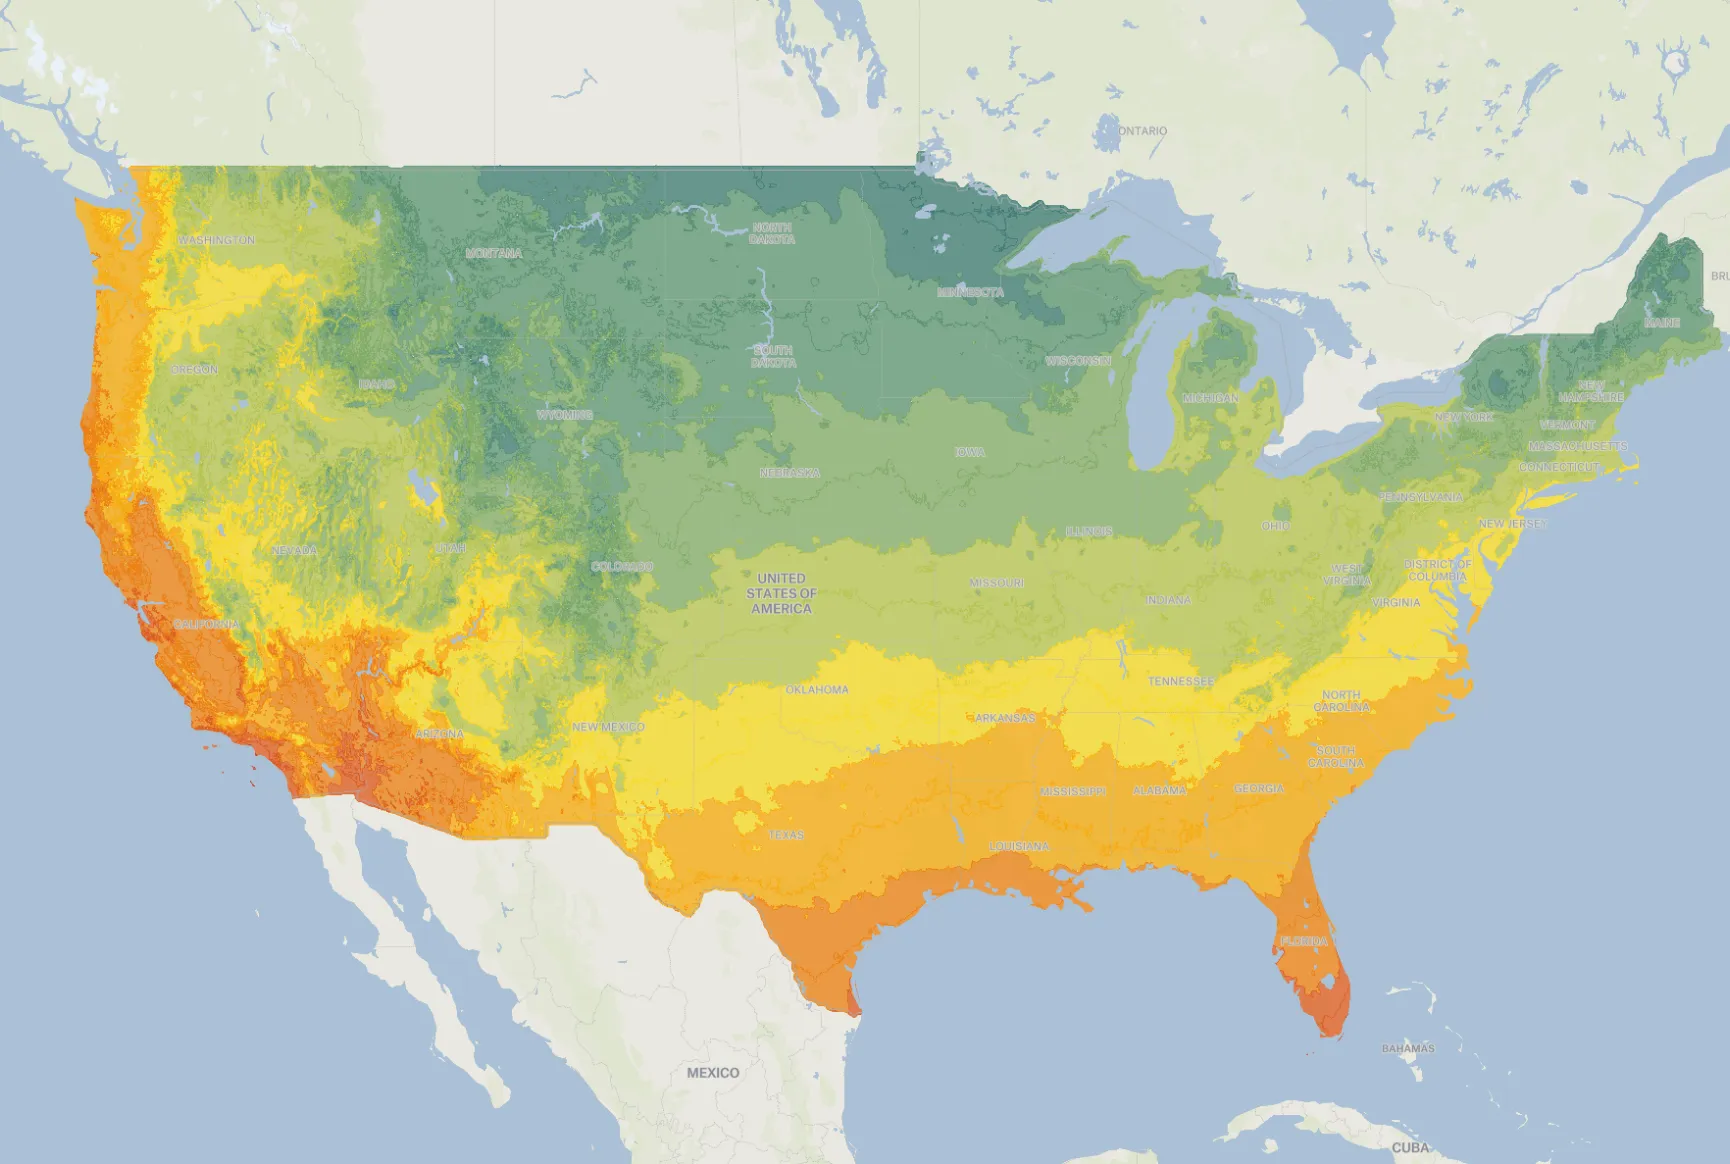
Plant Hardiness Zones
The USDA Plant Hardiness Zone Map (PHZM) is the standard by which gardeners and growers can determine which plants are most likely to thrive at a location. The most recent revision was prepared by the PRISM Climate Group at Oregon State University, and was released by USDA in 2012. Based on the average annual minimum winter temperature over a 30-year period, the map divides the country into zones representing a spread of 10°F (zones 1-13), each subdivided into two half-zones with 5°F spreads (e.g., zone 1a and 1b).
Categories
Boundaries
Climate
Infrastructure
Science