Soil mapping: How interactive surveys provide real insights
Soil mapping lets us understand what lies beneath our feet, guiding decisions on how to manage land, grow food, and build infrastructure. These maps highlight soil characteristics and help determine the most suitable uses for the land — whether that’s planting crops or laying real estate.
While soil surveys are still a trusted source of information, modern mapping has moved from manual digging into digital workflows. These tools use field data and remote sensing to capture conditions, like texture and drainage, so teams have up-to-date, accurate information.
Let’s look more closely at soil mapping, different analysis methods, and the ways companies put it to use.
What’s soil mapping?
Soil mapping — also called a soil survey — is the process of analyzing and classifying soil. It involves examining properties, like pH and carbon, and the ways they vary by location. Experts use this information to assess an area’s suitability for agriculture, engineering, and environmental conservation.
While they contain invaluable data, soil maps are scientific predictions, not real-time photographs. They offer a best estimate of where soil types are likely to occur based on landscape patterns, but it’s not a guarantee.
Types of soil mapping
In the past, creating soil maps involved exploring landscapes in-person. Now, scientists pair a hands-on approach with data-driven techniques, using computer models and environmental data sets to predict soil properties with incredible detail. Here are the two main soil mapping methods.
Conventional soil mapping
Soil mapping used to rely solely on field surveys. Scientists walked the land, dug holes to identify layers, and used physical examination to understand how soil types varied. They then manually drew lines on a map to define distinct soil areas.
Although conventional methods can produce reliable maps, they’re labor intensive and time-consuming. They also result in big picture maps rather than granular ones.
Digital soil mapping
Digital soil mapping (DSM) uses computer models to predict soil properties, combining field observations with satellite imagery and environmental data on climate and terrain.
Teams then analyze how these factors influence soil formation to estimate composition in areas that haven’t been sampled. This not only produces more information faster, it allows researchers to conduct in-depth spatial analysis, studying layered data patterns and relationships.
How soil mapping works
We can’t dig up every square inch of earth to see what’s underneath, so soil scientists rely on spatial prediction instead. Blending direct observation with advanced modeling creates highly accurate maps that show how soil changes across a landscape. Here’s how it works in practice.
Conducting field surveys and soil sampling
Traditional field sampling involves physically examining soils outside. This provides necessary baseline data that allow scientists to determine soil horizons and measure properties like pH and organic content.
There are three main methods:
- Exploratory: Broad-scale surveys identifying general soil patterns
- Reconnaissance: Medium-scale surveys collecting precise soil characteristics
- Detailed: In-depth surveys focusing on small areas for site-specific research
These investigations don’t just record data. They allow scientists to interpret soil patterns using frameworks like Climate, Organisms, Relief, Parent material, and Time (CLORPT). Observing how CLORPT factors interact helps explain and predict relationships within the landscape.
Observations also typically identify where the land sits in the Unified Soil Classification System (USCS). This soil classification determines the land’s structure, evaluating it based on factors like particle size and plasticity. Professionals use this information to gauge stability for construction projects.
Using remote sensing and environmental data
To fill in the gaps between field sites, soil mapping incorporates remote sensing and environmental data.
Scientists use satellite imagery and environmental covariates — including elevation models, climate data, and vegetation patterns — to estimate soil properties in areas unvisited or unsampled. These data points represent CLORPT variables.
Modern soil mapping applies both techniques. Pairing field surveys with broad-scale environmental data helps people build precise predictions. That way, they receive a continuous, accurate view of the landscape with less ground work.
Creating soil maps and reports
Researchers must compile and structure the data from field observations into something usable and accessible. This is where soil reports and maps come in. Reports are official publications describing the classification and properties of the land. Maps are the part businesses use practically — the interactive, visual aids that help people understand the earth and make informed decisions.
Accessing soil maps online
Today, many soil surveys are available through government repositories, survey portals, and geographic information systems (GIS). National soil agencies often publish these data sets so planners and land managers can explore soil conditions and evaluate land suitability.
In the U.S., the most popular public-facing platform is the USDA NRCS Web Soil Survey (WSS). It’s an interactive map that lets users view soil features and create custom reports. The WSS builds on conventional survey methods by making classification data and capability ratings accessible through a digital interface.
While these platforms make soil information easier to access, the underlying data still comes from traditional soil surveys. These surveys provide solid foundational data, but they’re often simple static reports or polygon map layers. To use them in modern analysis, teams usually need to import the data into GIS and combine it with other spatial layers.
Here’s a soil map made in Felt. It takes survey data and translates it into a dynamic, interactive form. This example shows water holding capacity through a color gradient and lets users sort by drainage class.
Applications of soil mapping
Here are a few industries and the real ways they use soil maps.
Agricultural planning and precision farming
Farmers use mapped data on soil texture, nutrient levels, and water-holding capacity to determine which crops will perform best. It also helps them choose inputs like irrigation and fertilizer. For example, areas with sandy soils may need more frequent watering, while soils rich in organic carbon tend to hold onto nutrients and need less water overall.
Urban planning and land capability assessment
Soil mapping helps planners evaluate whether land is suitable for development. Drainage and soil stability affect where businesses can safely place buildings, roads, and septic systems. Suppose an area has clay-rich soils. This ground type significantly shrinks when dry and expands when wet. Construction teams will need special building techniques and careful drainage management to prevent future instability.
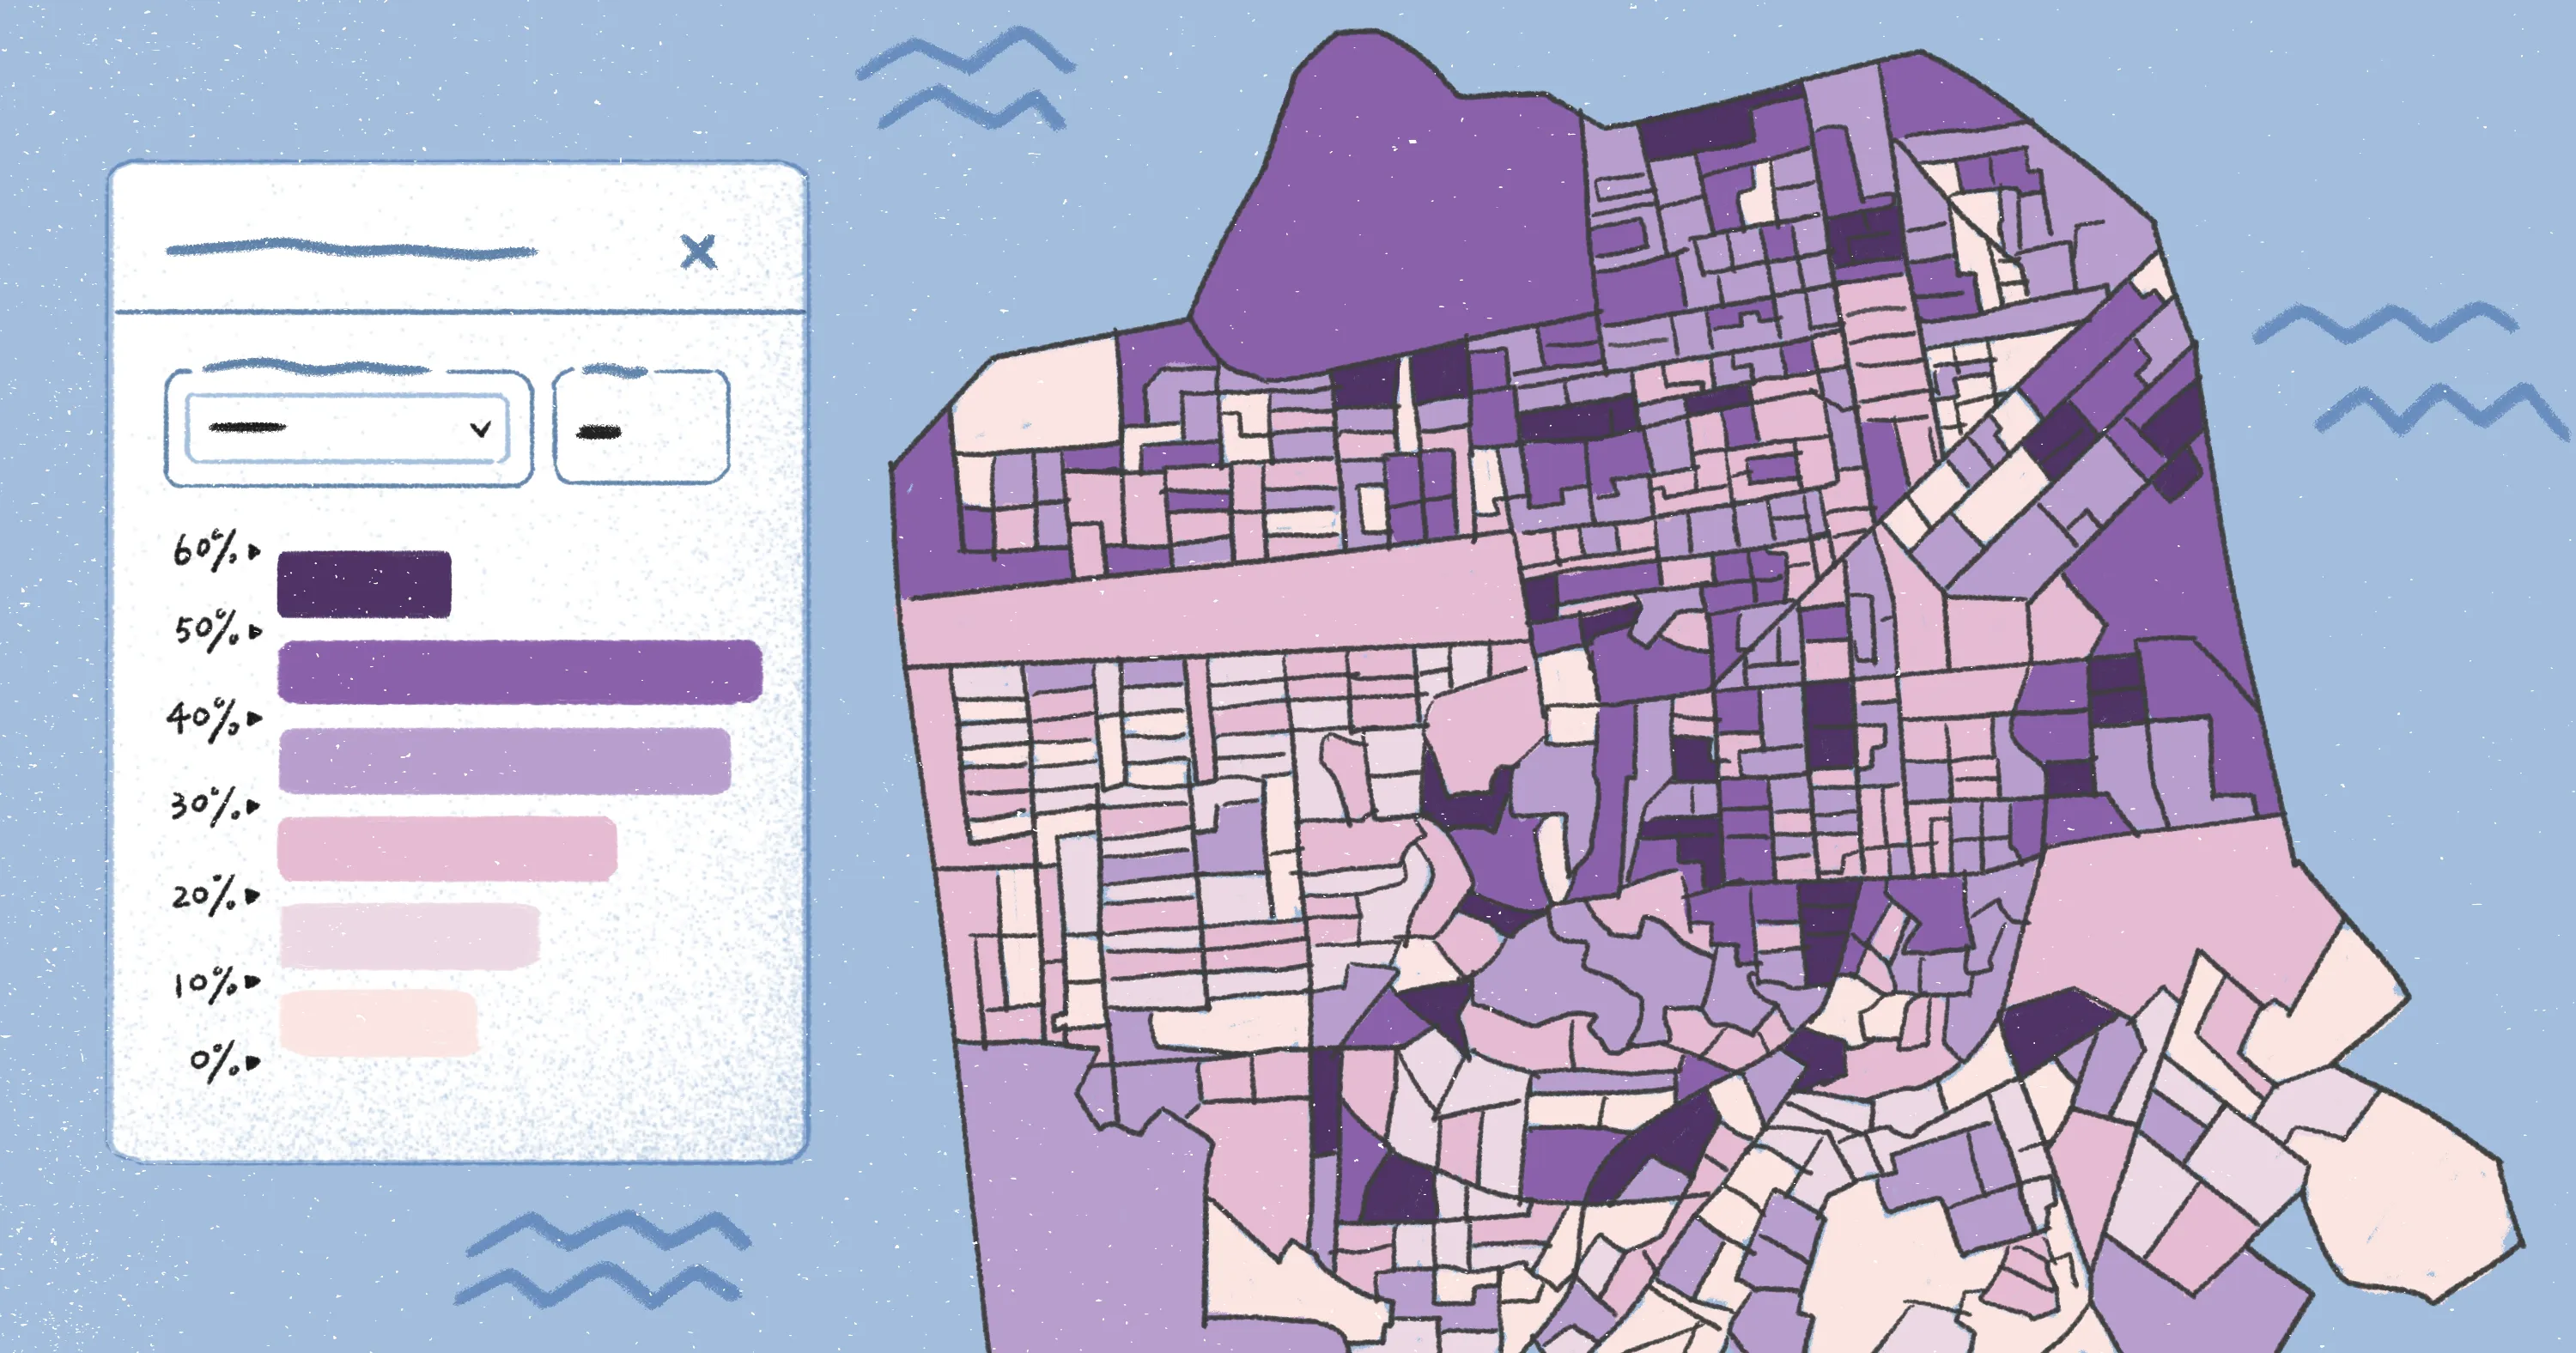
Here’s an example of a soil map of upstate New York, showing color gradients to represent clay percentages:
Environmental monitoring and carbon modeling
Soil maps help identify vulnerable areas and monitor ecosystem health. By tracking properties like organic carbon and erosion risk, researchers and land managers can detect soil degradation, protect wetlands, and plan restoration projects.
Mapping also highlights where soil resources are under the greatest pressure so you can prioritize and prepare conservation efforts.
Create in-depth soil maps with Felt
Soil survey data rarely stands on its own. Most teams need to layer it with other spatial data before they can put it to practical use. Felt makes this process a breeze.
This cloud-native GIS brings soil data, satellite imagery, and zoning layers into one shared workspace. Instead of passing files back and forth, teams can collaborate on the same map in real time and share interactive maps instantly.
Plus, with Felt’s Field App, teams can collect soil observations and site notes on the spot, which immediately sync back to the map. Capture information with automatic location tracking, attach geotagged photos for context, and provide instant updates to office teams.
Start creating today. Book a demo with Felt, and transform surveys into interactive, actionable tools.
FAQ
What’s the difference between soil mapping and soil testing?
Soil mapping shows how soil types vary across a landscape, usually based on field observations and spatial analysis. Soil testing, on the other hand, analyzes a specific soil sample in a lab to measure properties like pH and nutrient levels.
How often should people update soil maps?
Soil maps don’t need constant updates, but they should be revised when new data becomes available. Many organizations update their maps whenever improved satellite data or new sampling results come in. As a general recommendation, update your survey data and maps every one to five years.
What are red flags on a soil survey?
Common red flags on a soil survey are items like poor drainage, high erosion risk, and soils that shrink and swell with moisture. These conditions can limit projects, introducing challenges that require additional site investigation and special techniques.
Compare Felt using AI


.webp)
.jpg)