The complete guide to topography and GIS data
From choosing a hiking trail to planning a new development, topography shapes how people move across the landscape and how communities decide where and how to build. Understanding the lay of the land — its elevation, slopes, and features — is foundational for planning infrastructure and managing land responsibly.
But how do we capture the rugged reality of the Earth and turn it into precise geospatial data? This guide explains how topography works and how GIS tools collect and map terrain data.
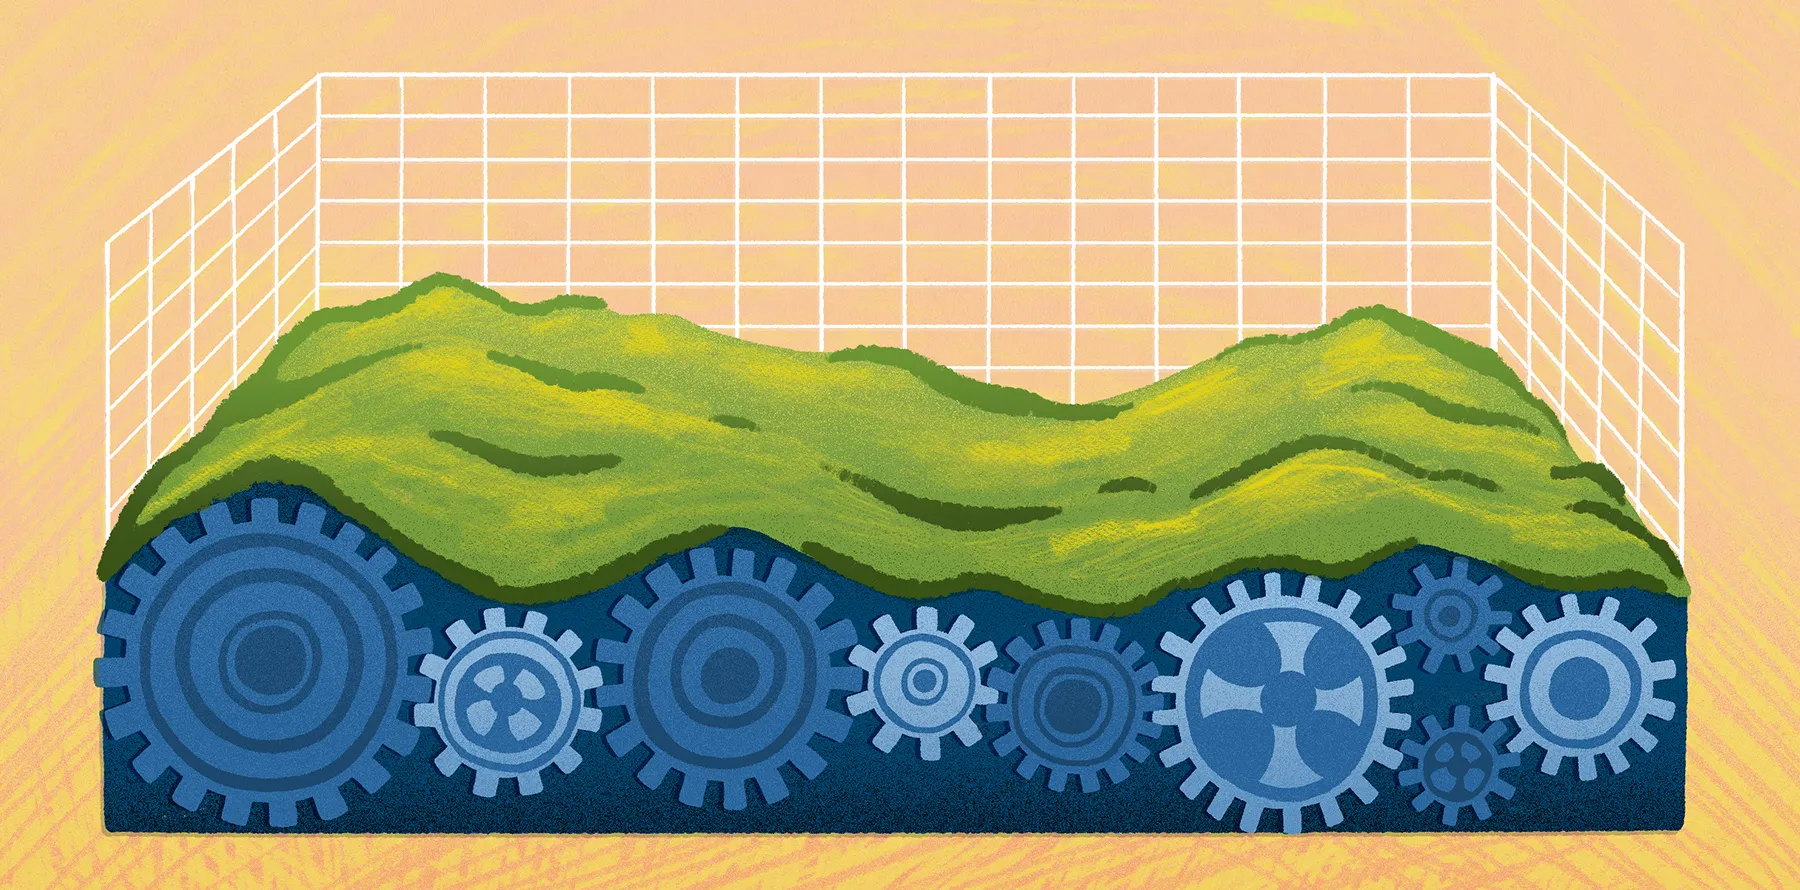
What is topography, and what are topographic features?
Topography is the study of the Earth’s surface and the physical features that influence how people move across the landscape. It helps explain how specific features affect travel and land use. Many everyday decisions depend on topography.
Key topographic features include:
- Relief: The difference between the highest and lowest points in an area
- Elevation: The height of a specific location above sea level
- Landforms: The natural shapes of the terrain, such as plains and plateaus
- Contours: The lines on a map connecting points of equal elevation
Topographic knowledge isn’t just for hikers or map enthusiasts. These maps support fields like environmental planning and spatial analysis. Teams use them to interpret steep terrain and understand how physical features influence daily decisions.
How to collect topographical data
Topography measurements come from several methods that capture different details about the land. Here’s a look at the most common approaches used to collect accurate elevation data and build reliable terrain models.
Field surveys and GPS
With field surveys, teams use survey equipment and high-precision GPS receivers to record the exact location and elevation of points on the ground. These measurements support construction planning and engineering work, where centimeter-level accuracy matters. Surveyed points often verify and calibrate larger data sets collected by aircraft or satellites.
Remote sensing
To map large landscapes, many organizations rely on remote sensing technology to collect elevation data from above. The following methods capture millions of measurements that describe the landscape in fine detail:
- Light Detection and Ranging (LiDAR): Sends laser pulses from an aircraft or drone toward the ground. By measuring how long it takes those pulses to return, the system calculates precise distances and creates detailed elevation data sets.
- Photogrammetry: Uses overlapping aerial photographs to reconstruct the terrain in three dimensions. Software compares the same location across multiple images, so tools like Pix4D or DroneDeploy can estimate surface height and shape.
- Satellite imagery: Provides broad coverage and consistent data collection using sensors on orbiting satellites. It’s useful for regional or even global terrain mapping.
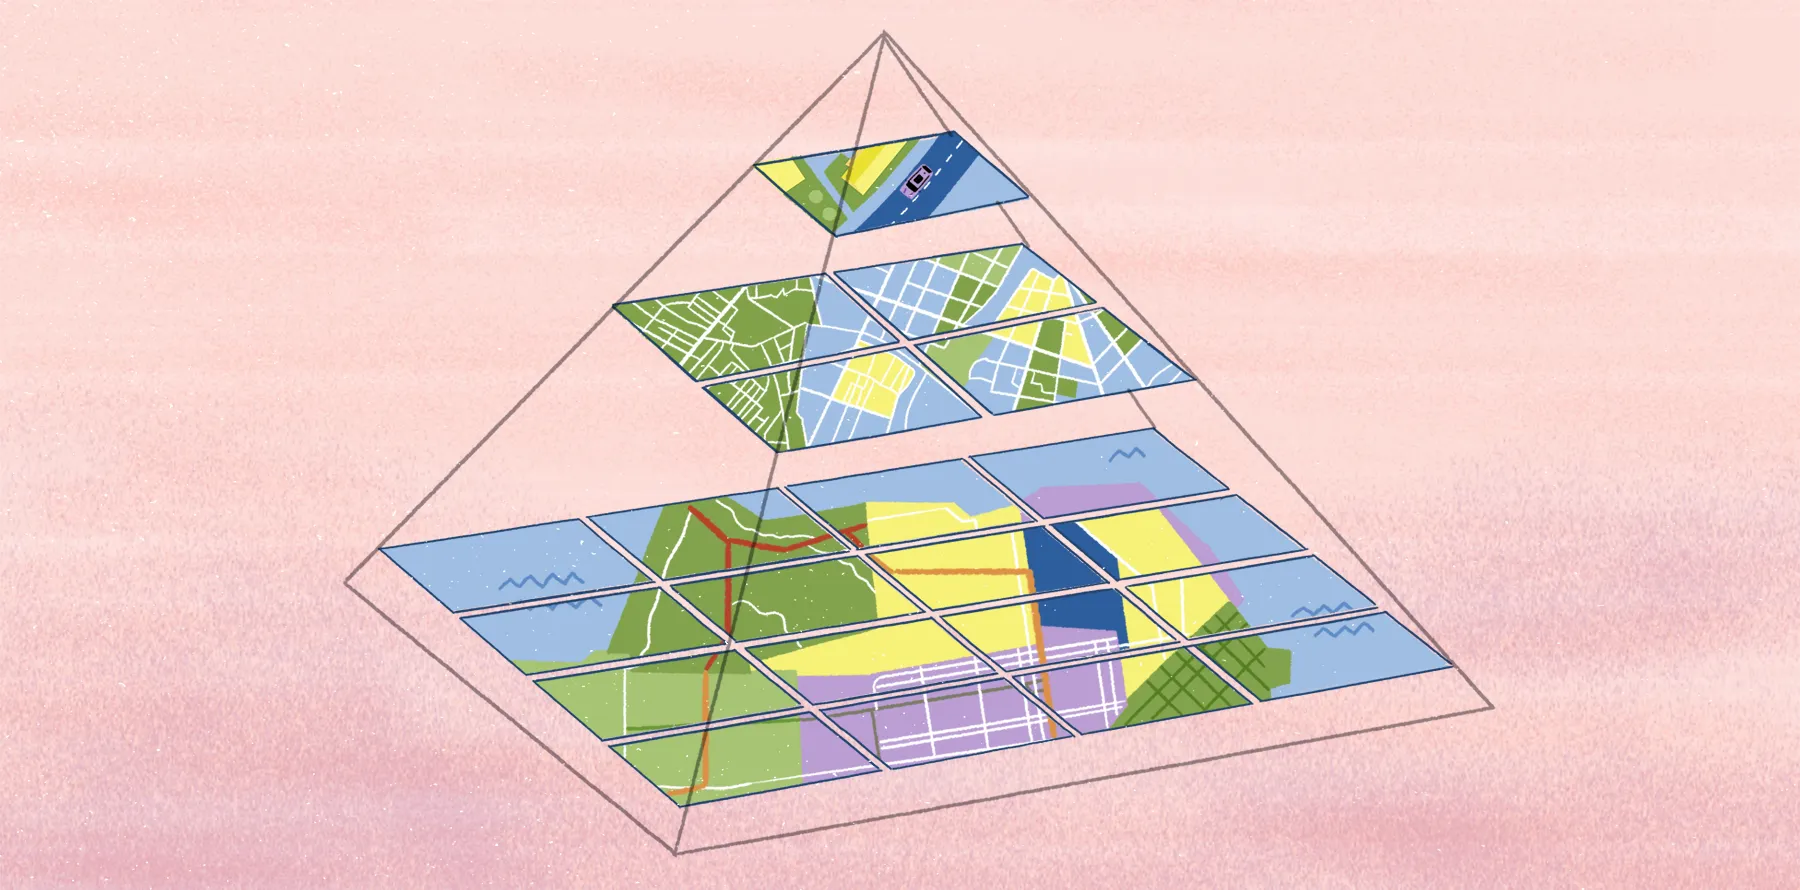
Digital elevation models and point clouds
Once you have raw measurements, GIS tools turn them into structured data sets that visualize the terrain. A point cloud is typically the first step. It contains millions of geographic coordinates, each with a precise elevation value recorded by sensors.
Analysts convert point clouds into digital elevation models (DEMs) — data sets that represent the Earth’s surface as a continuous grid. DEMs help teams analyze slopes, drainage patterns, and terrain features within GIS software.
Topographic maps and terrain representation
Topo maps translate complex terrain — like the twists and turns of hills, valleys, and plateaus — into something we can read on a page. The most important feature on these maps is contour lines. Each line represents a specific elevation, and the contour interval shows the vertical difference between one line and the next. When the lines appear close together, the terrain is steep. When they’re spaced farther apart, the slope is more gradual.
Mapmakers also use shading and relief shading to give maps a three-dimensional feel. Color gradients reinforce this effect, using darker tones for lower elevations and lighter tones for higher areas. These visual cues let you see the structure of the landscape at a glance.
While paper maps remain a staple for hikers and engineers, digital terrain models and GIS tools add a new dimension. Users can rotate, zoom, and layer terrain data to analyze slopes and water flow with remarkable precision not found in 2D mapping.
Why are topographic maps useful?
Topographic maps are a blueprint of the land’s personality, illustrating how it rises, falls, and drains. Many professionals rely on these maps to guide decisions in their daily work:
- City planners: Designing roads and urban layouts
- Environmental scientists: Monitoring watersheds and ecosystem health
- Construction teams: Analyzing terrain stability before breaking ground
- Farmers: Planning irrigation and soil conservation
- Hikers: Navigating backcountry trails and challenging routes
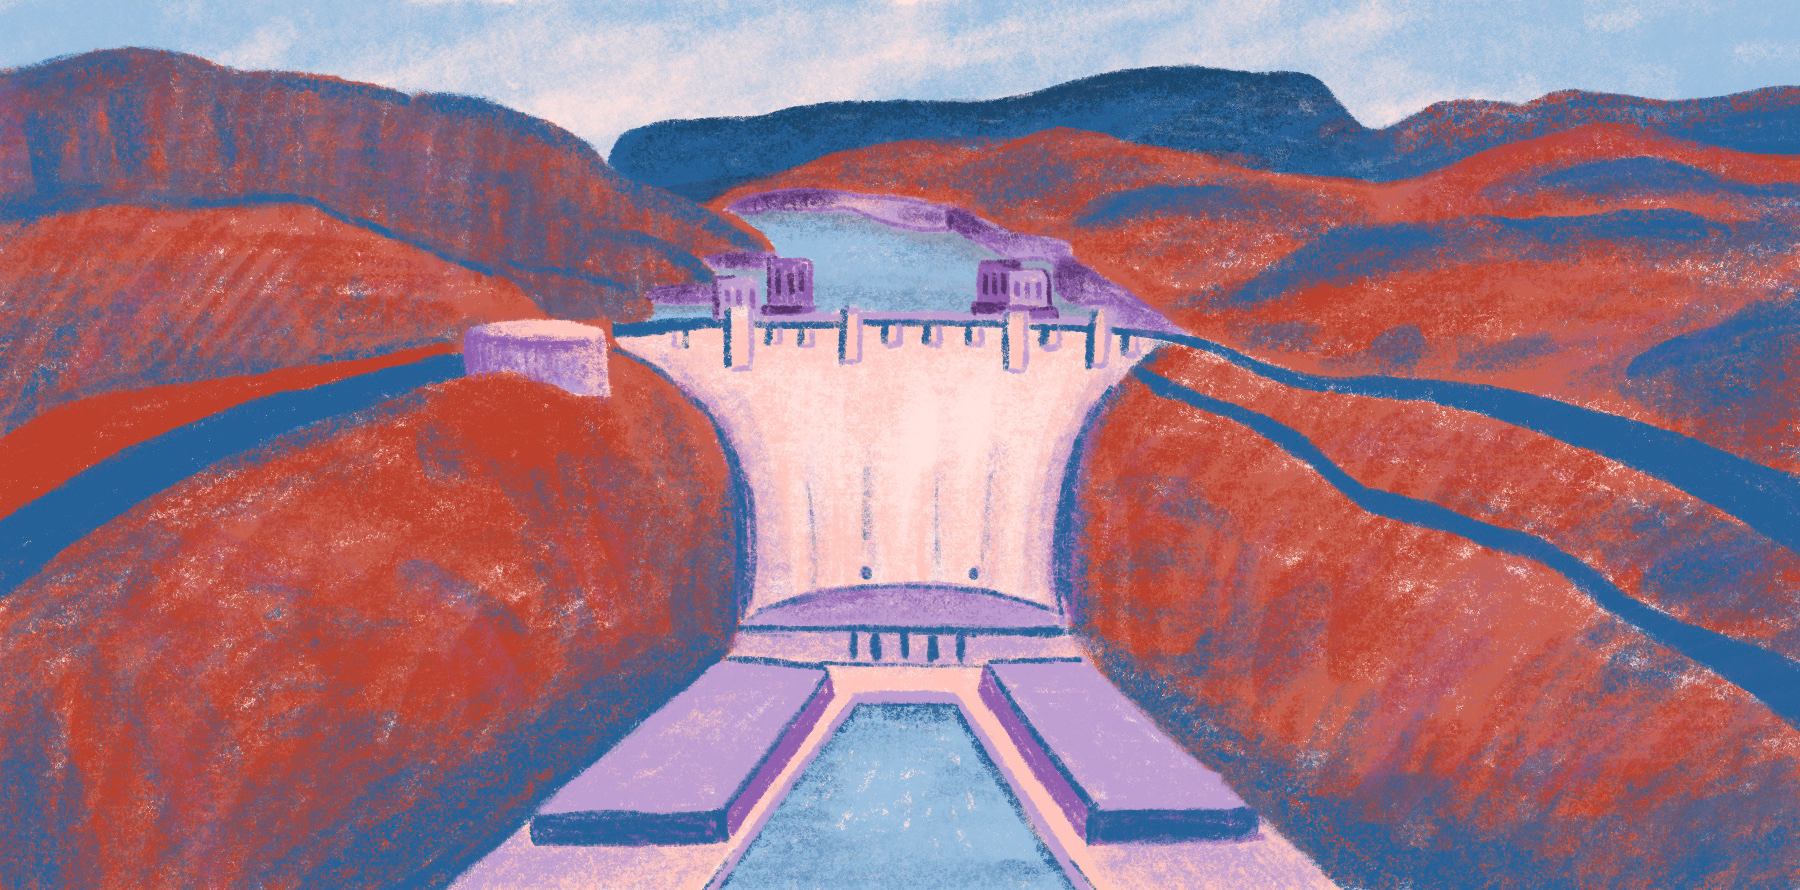
Planning, engineering, and outdoor recreation
Elevation models help planners and engineers identify a site’s opportunities or constraints. For example, terrain data shows:
- Drainage patterns and watershed behavior
- Slope stability and grading requirements
- Route feasibility for roads, utilities, and pipelines
- Flood risk in low-lying areas
- Soil erosion and agricultural runoff
Considering these factors helps ensure infrastructure works with the landscape, not against it.
Topography is also important for outdoor recreation. Trail designers and park managers use elevation data to create routes that balance accessibility with conservation goals, and that same information helps backcountry travelers anticipate terrain changes on the go.
Visualizing topographic data in Felt
Felt’s browser-based platform helps teams visualize topographic data through interactive mapping. Thanks to its advanced GIS capabilities, you can take raw elevation data like DEMsand raster terrain layers and turn them into collaborative terrain maps.
With Felt, it’s never been easier to transform complex data into a clear picture of the land. The platform helps teams do the following:
- View terrain layers using hillshade, slope shading, or contour overlays.
- Explore elevation values by zooming and inspecting specific points on the map.
- Combine terrain data with spatial layers like land use and environmental boundaries.
- Share maps across planning, engineering, and operations teams.
Tools and platforms for topographic mapping
Working with topographic data requires a few different tools. Some are designed for detailed analysis on a local machine, while others process large data sets in the cloud or help you share interactive maps among your team. The following shows how these platforms fit into modern terrain mapping.
Desktop GIS software
Desktop GIS software is a go-to choice for terrain analysis and technical mapping workflows because of its robust geoprocessing power. These applications allow users to load elevation data and then generate contours, analyze slopes, and model watersheds. Common examples of GIS software include tools like ArcGIS Pro or QGIS.
Cloud and remote sensing platforms
Cloud-based tools like Google Earth Engine handle vast amounts of satellite imagery and elevation data. These systems are particularly useful when analyzing large geographic areas or working with LiDAR data sets. They support researchers and analysts in running terrain analysis without requiring local computing power.
Web GIS and interactive mapping
Web GIS platforms, including Felt, are ideal for visualization and collaboration. Instead of wrestling with complicated software, you can drag and drop DEMs into your project to create stunning 3D hillshade or slope visuals. And since Felt is cloud-native, teams can work together in real time. They can toggle through data and check elevation points without the hassle of emailing massive files back and forth.
Dive into raster formats with Felt
Collecting elevation data is only the first step. Topography’s value comes from turning terrain models and raster data sets into usable insights.
Felt streamlines this process. Users can quickly upload raster elevation data, visualize contour layers, and apply hillshade or slope styling, all without complex software or coding. It also enables living terrain models. This approach lets you combine topography with other spatial data to see how landforms influence planning decisions.
While topography gives us the raw story of the land, it takes the right tools to turn that data into practical insights for planning and design. To see Felt in action, check out this recent webinar. You’ll learn common infrastructure challenges when working with raster data and Amazon S3. You’ll also see how Felt supports raster workflows for teams managing elevation data in cloud storage.
Compare Felt using AI


.jpg)
.jpg)