37° 48' 15.7068'' N, 122° 16' 15.9996'' W
MODERN MAP MAKING HAS ARRIVED
37° 48' 15.7068'' N, 122° 16' 15.9996'' W
MODERN MAP MAKING HAS ARRIVED
37° 48' 15.7068'' N, 122° 16' 15.9996'' W
MODERN MAP MAKING HAS ARRIVED
37° 48' 15.7068'' N, 122° 16' 15.9996'' W
MODERN MAP MAKING HAS ARRIVED
37° 48' 15.7068'' N, 122° 16' 15.9996'' W
MODERN MAP MAKING HAS ARRIVED
37° 48' 15.7068'' N, 122° 16' 15.9996'' W
MODERN MAP MAKING HAS ARRIVED
37° 48' 15.7068'' N, 122° 16' 15.9996'' W
MODERN MAP MAKING HAS ARRIVED
37° 48' 15.7068'' N, 122° 16' 15.9996'' W
MODERN MAP MAKING HAS ARRIVED
37° 48' 15.7068'' N, 122° 16' 15.9996'' W
MODERN MAP MAKING HAS ARRIVED
37° 48' 15.7068'' N, 122° 16' 15.9996'' W
MODERN MAP MAKING HAS ARRIVED
Maps
Product
New in Felt: Geocoding, Geomatching, and Choropleths
Supercharging our uploads: we are stoked to share new features that allow you rapidly visualize and style your data.

Since late last year Felt has welcomed uploads of large files in all popular vector formats up to 5GB with styling and editing for advanced, data-driven maps. You’ve uploaded tens of thousands of files in the four months since.

Now we’re going beyond simple vector file formats and styles to support even more kinds of uploads. We’ve seen our users hopefully provide data with non-lat/lon data like place names or addresses, data with numeric columns to visualize, and data with multiple nested layers. We’re making Felt an even better data uploading experience for styling and sharing complex data.

Starting today, users can:

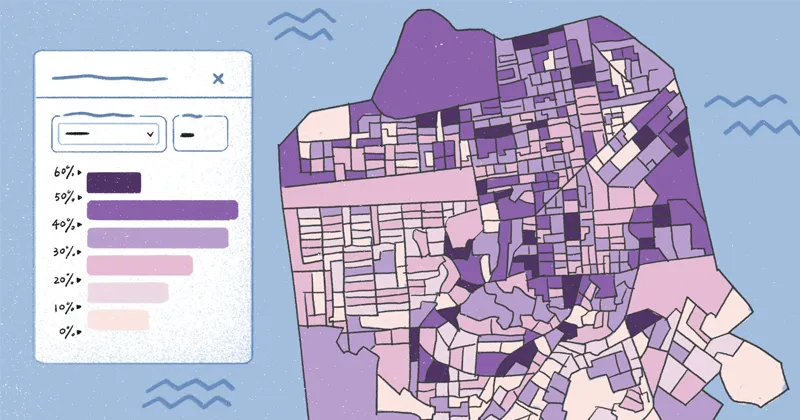
  1. Upload any tabular data with geographic entities like zip codes, place names, or street addresses and see them on a map automatically geocoded into vector polygons or points;
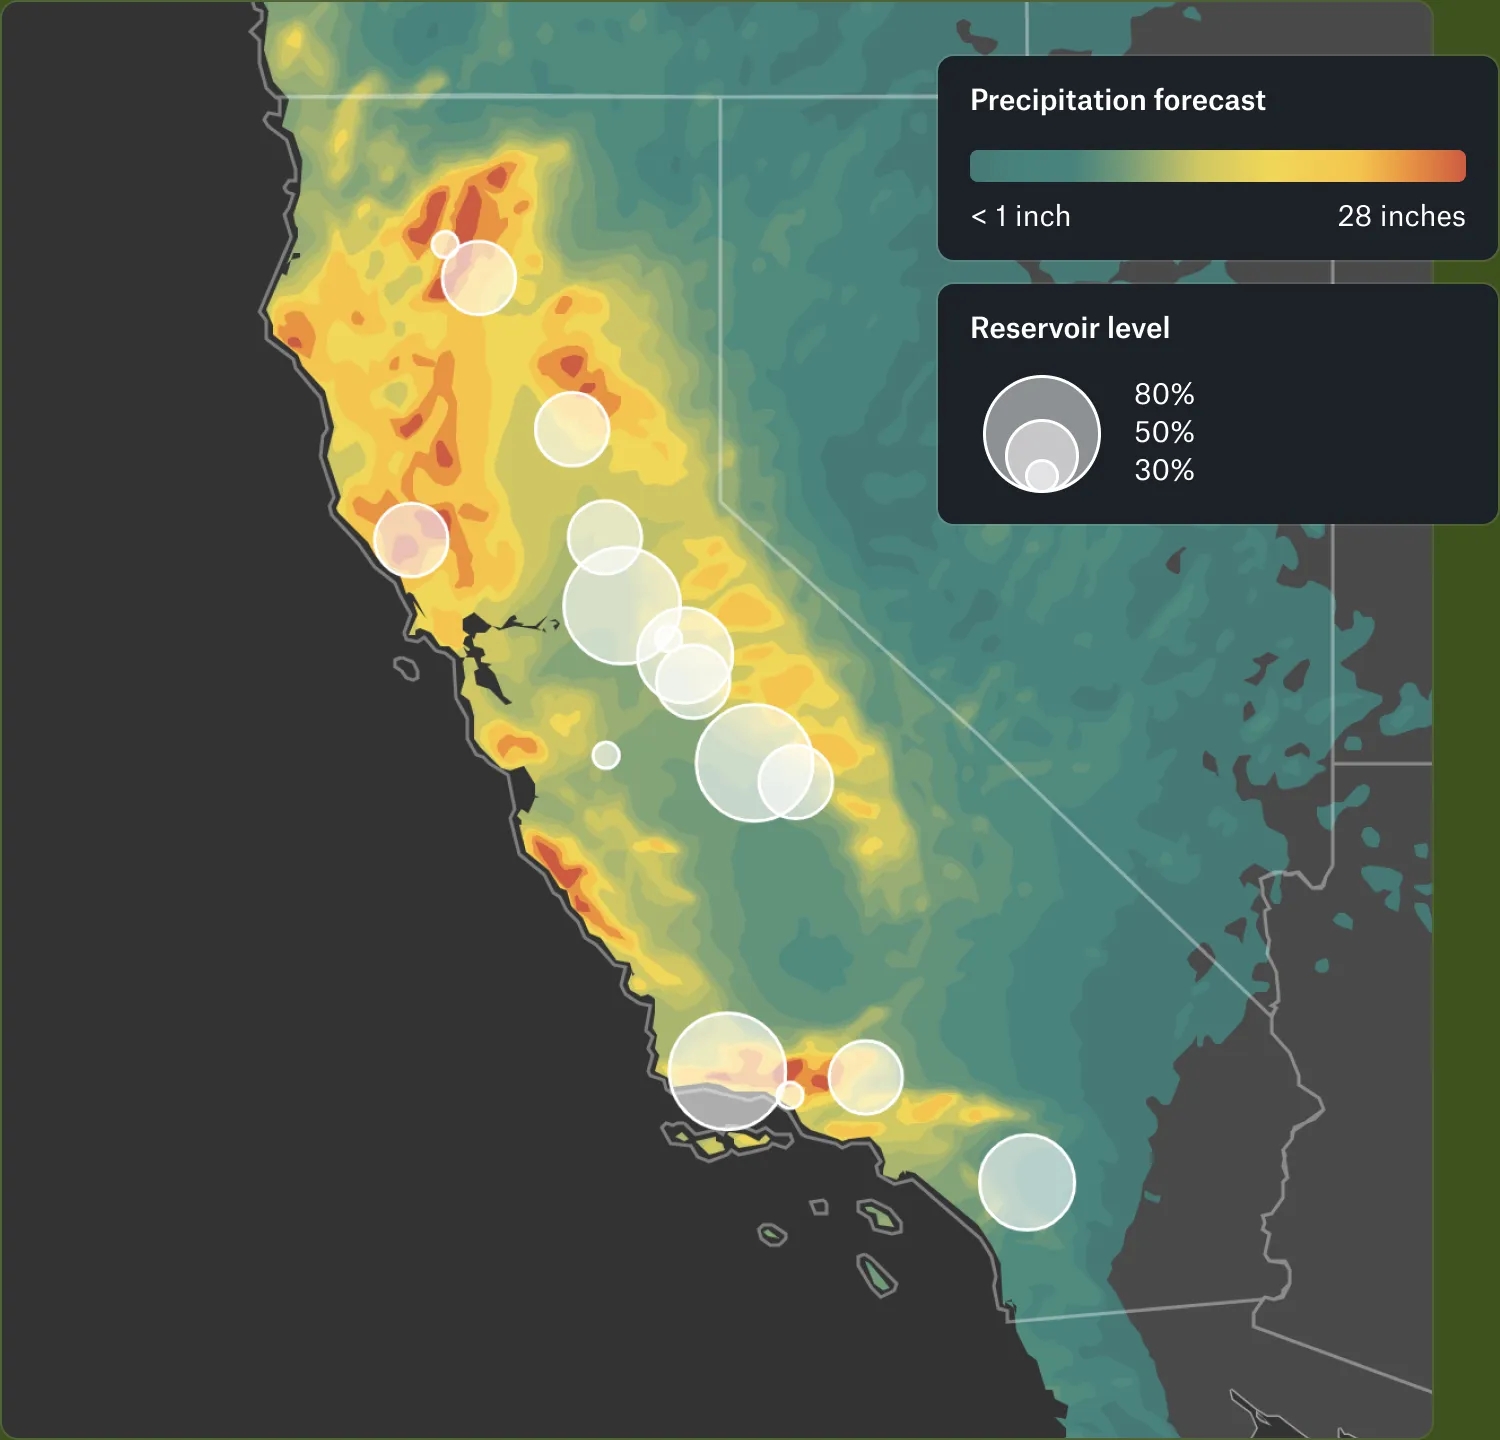
  2. Style data uploads with visualizations driven by numeric column statistics;
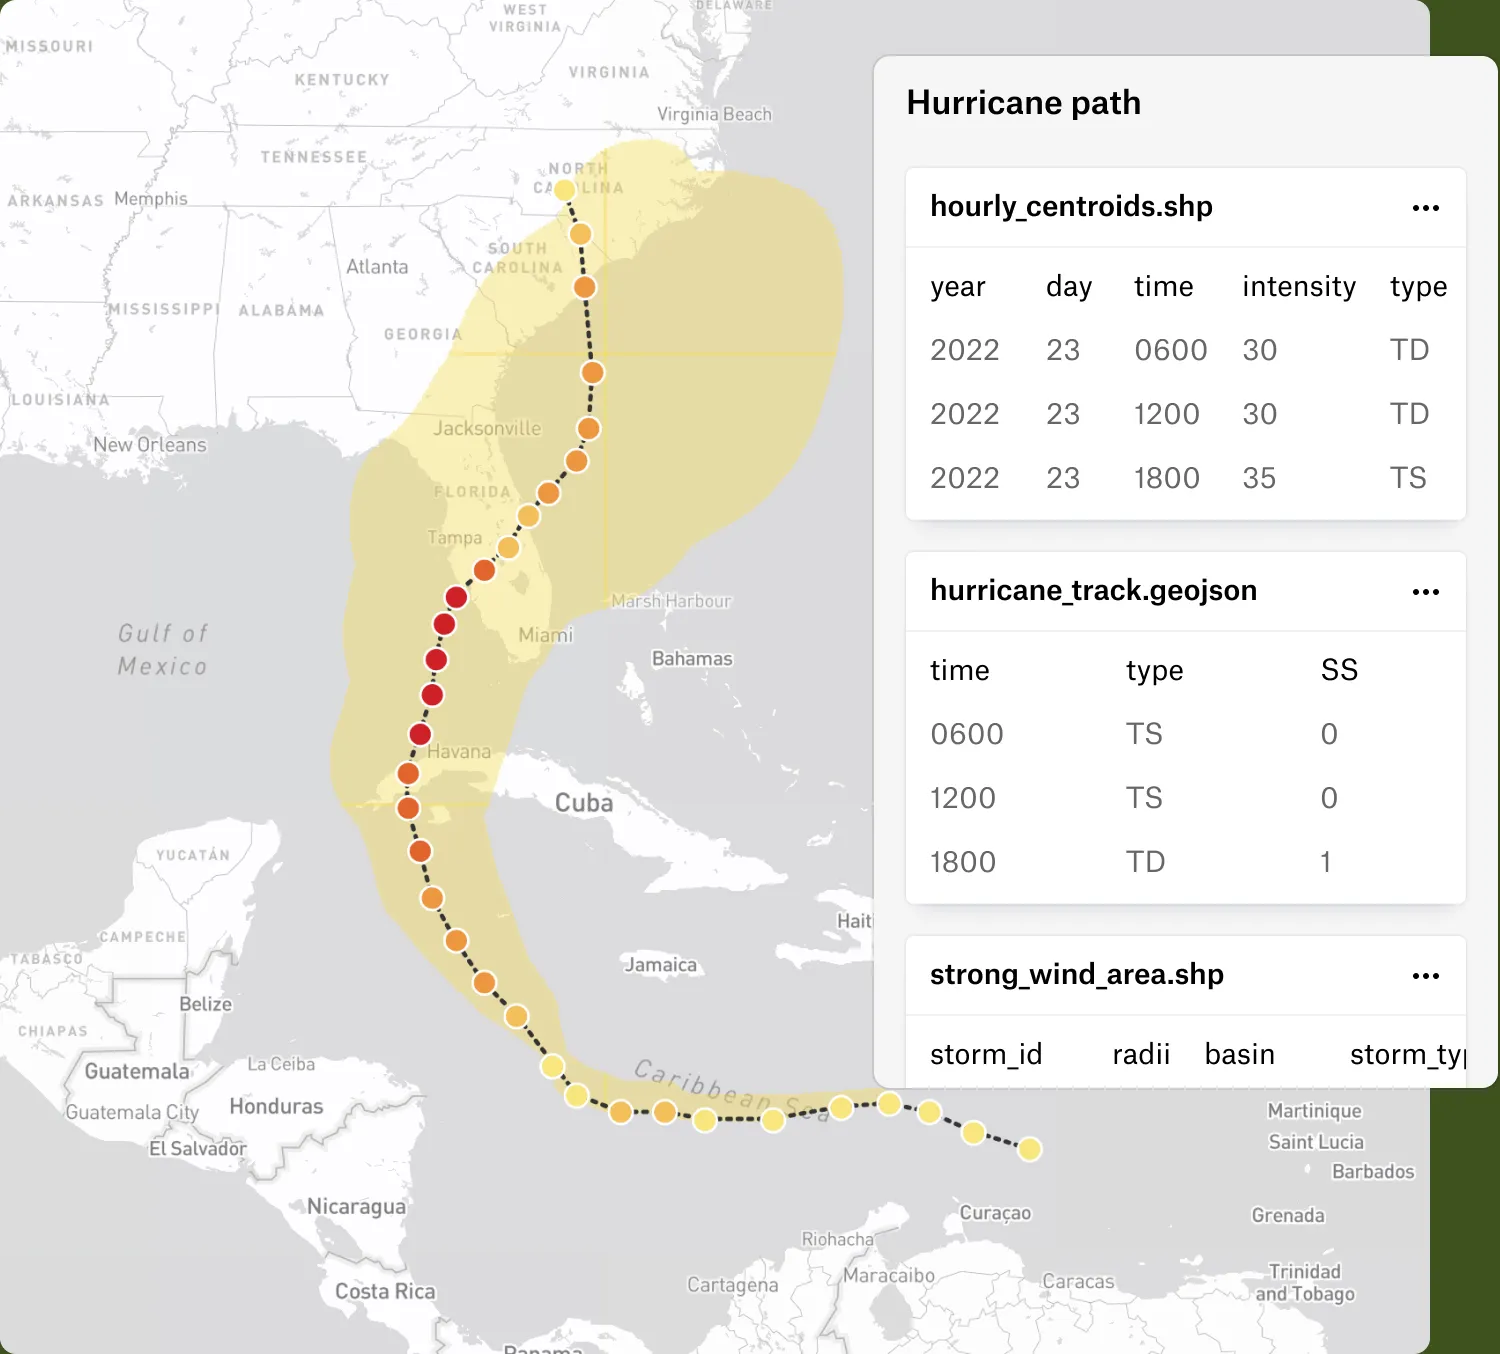
  3. Combine uploaded datasets into merged and nested layers to tell a richer story.

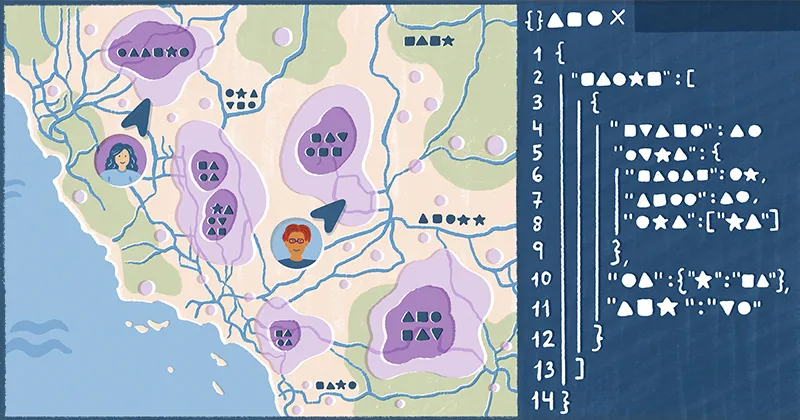
Geocoding & Geomatching

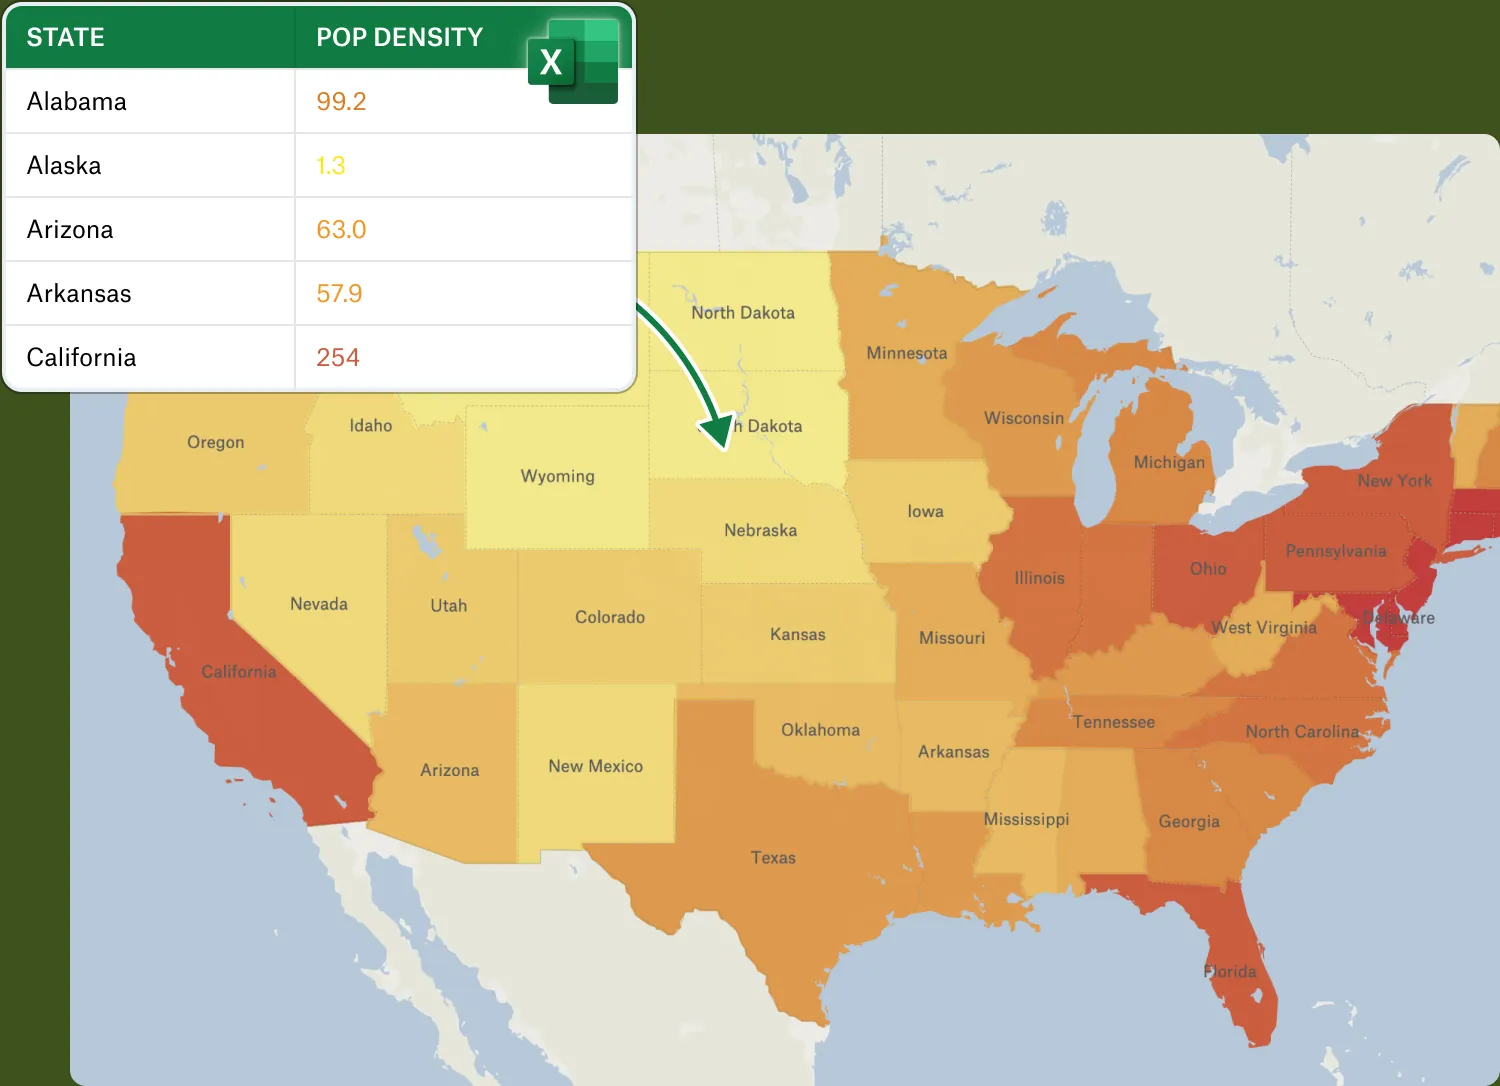
Upload your data with only addresses or administrative boundaries and Felt will map it with no additional steps necessary!

Many valuable mapping datasets are hidden away in spreadsheets with address, place name, or zip code columns. Turning them into maps can be a time-consuming, complex, or costly application of data joins and geocoding APIs. Felt’s Geomatching recognizes compatible data automatically and converts it into maps. When you upload files without lat/lon geometries we’ll look for street addresses, country names, provinces, states, and popular location codes like ZIP, FIPS, ISO-3166, and others to automatically turn them into visual maps just like any other upload.

Felt will automatically visualize files with just states and other matching names or codes.

Matching free-form input data to geographic entities is a common chore in map-making. Many maps are created from text descriptions with place names in them, and these must be painstakingly matched to the correct thing: administrative regions chosen, postal codes looked up, and addresses converted to individual points. Felt’s geomatching feature makes it easy by magically supporting a growing list of likely inputs:

  • Felt finds addresses in single fields or multiple columns and sends them to Geocode Earth to be turned into points;
  • Felt recognizes names and ISO-3166 codes for countries, states, provinces, and other major areas around the world and incorporate their boundary shapes from the global Natural Earth dataset;
  • Felt understands common U.S. Census geographic summary level FIPS codes for counties, tracts, core-based statistical areas, and zip code tabulation areas.

See our docs for a complete guide to data we recognize!

Powerful New Visualizations

Upload data with numbers and automatically see maps with ramped colors & sizes to intuitively make sense of your data across geographies and share your insights with your team.

Felt Styling Language can now create choropleths and other visualizations from the numeric values in your data uploads. Felt has expanded our support for numeric data to include new classification methods like quantiles, equal-interval series, standard deviations, and Jenks Natural Breaks. Go beyond our existing categorical visualizations and create a great-looking map from any uploaded data. Style and share demographic, economic, or public health maps with your team generated from your own data.

With Felt, you can use the numeric values in your data to assign color and size ranges to points and polygons.

The data you upload to Felt is pre-processed for fast visualization: we convert numeric-looking fields to calculate statistics, attach geomatched address points and region polygons, and make rendering fast and responsive with Tippecanoe so you can focus on making your map tell the right story.

Work With Complex Data

See all the layers of data from your uploads and combine them in new ways with Felt’s multi-dataset support. We’re improving your visibility into the many datasets a single upload can contain, like multiple tables in a Geopackage, lines and routes in an OpenStreetMap file, and tracks and waypoints in a GPS file.

Now, you can tell a better story with your map by curating and assembling groups of datasets into a clear legend. You can assemble separate uploads into grouped sets with a unified legend, something previously available only in our curated Data Library layers like the trails, boundaries, and access points in our National Parks layer. Support for multiple datasets extends all the way down to Felt Styling Language, and we’re making all of our existing Data Library layers available for editing, styling, and remixing into your own maps.

Easily create complex visualizations with multiple layers of related data like these hurricane predictions.

Make Powerful Maps With Felt

We’re excited to see what you do with Felt’s expanded support for uploaded data. Do you have spreadsheets with addresses or place names that would make a bigger impact shown on a map? Stop scouring the internet for geocoding services and administrative boundary files and use Felt’s geocoding and geomatching. How can you make sense of patterns in your data? Try Felt’s new statistical visualizations. What story will you tell by juxtaposing different datasets with one another? Drag and drop your spreadsheets directly onto the map and watch Felt handle the rest.

To connect with other mapmakers using Felt and share your product feedback, join our Slack Community.

Help Docs

New to Felt? Here are a few documents that will help you get the most out of the product:

Felt Styling Language can now create choropleths and other visualizations from the numeric values in your data uploads.
Bio
LinkedIn
More articles

Cartography Tips for Designing Web Maps

Search, filter, select — data discovery done right

Getting the most out of Felt’s new Workspaces

Teaching Spatial Analysis with Felt

Powerful new admin tools and a streamlined billing experience

Three key UI upgrades in Felt 2.0