.jpg)
Examples of GIS: How teams use spatial data to solve problems
Geographic information systems (GIS) help us make sense of location-based data, revealing real-life patterns across geography. By mapping and processing raw spatial data, GIS turns complex information into a compelling story about relationships on the ground.
While it’s enlightening to discuss data visualization and decision making, the best way to understand this tool’s true value is seeing examples of GIS. Mapping software informs real-world action, helping teams predict wildfires, improve soil conditions, and choose competitive real estate locations.
Let’s take a closer look at what GIS is used for and which businesses benefit from it.
Why is GIS used across so many industries?
Businesses use GIS technology because countless decisions involve geospatial data. Whether you’re mapping a new subway line or selecting a location for a coffee shop, you need to see how those plans play out in the real world. Here are a few reasons that companies use GIS:
- It spots hidden patterns: Spreadsheets show what is happening, but GIS lets you visualize where and why. It maps out geographic clusters like supply chain bottlenecks and “hot spots” of customer complaints that are hard to spot in static spreadsheet data.
- It leads to better decisions: With GIS, teams can map asset locations like stores and warehouses alongside potential risk factors like flood zones and traffic data. This leads to better site selection and more proactive crisis response.
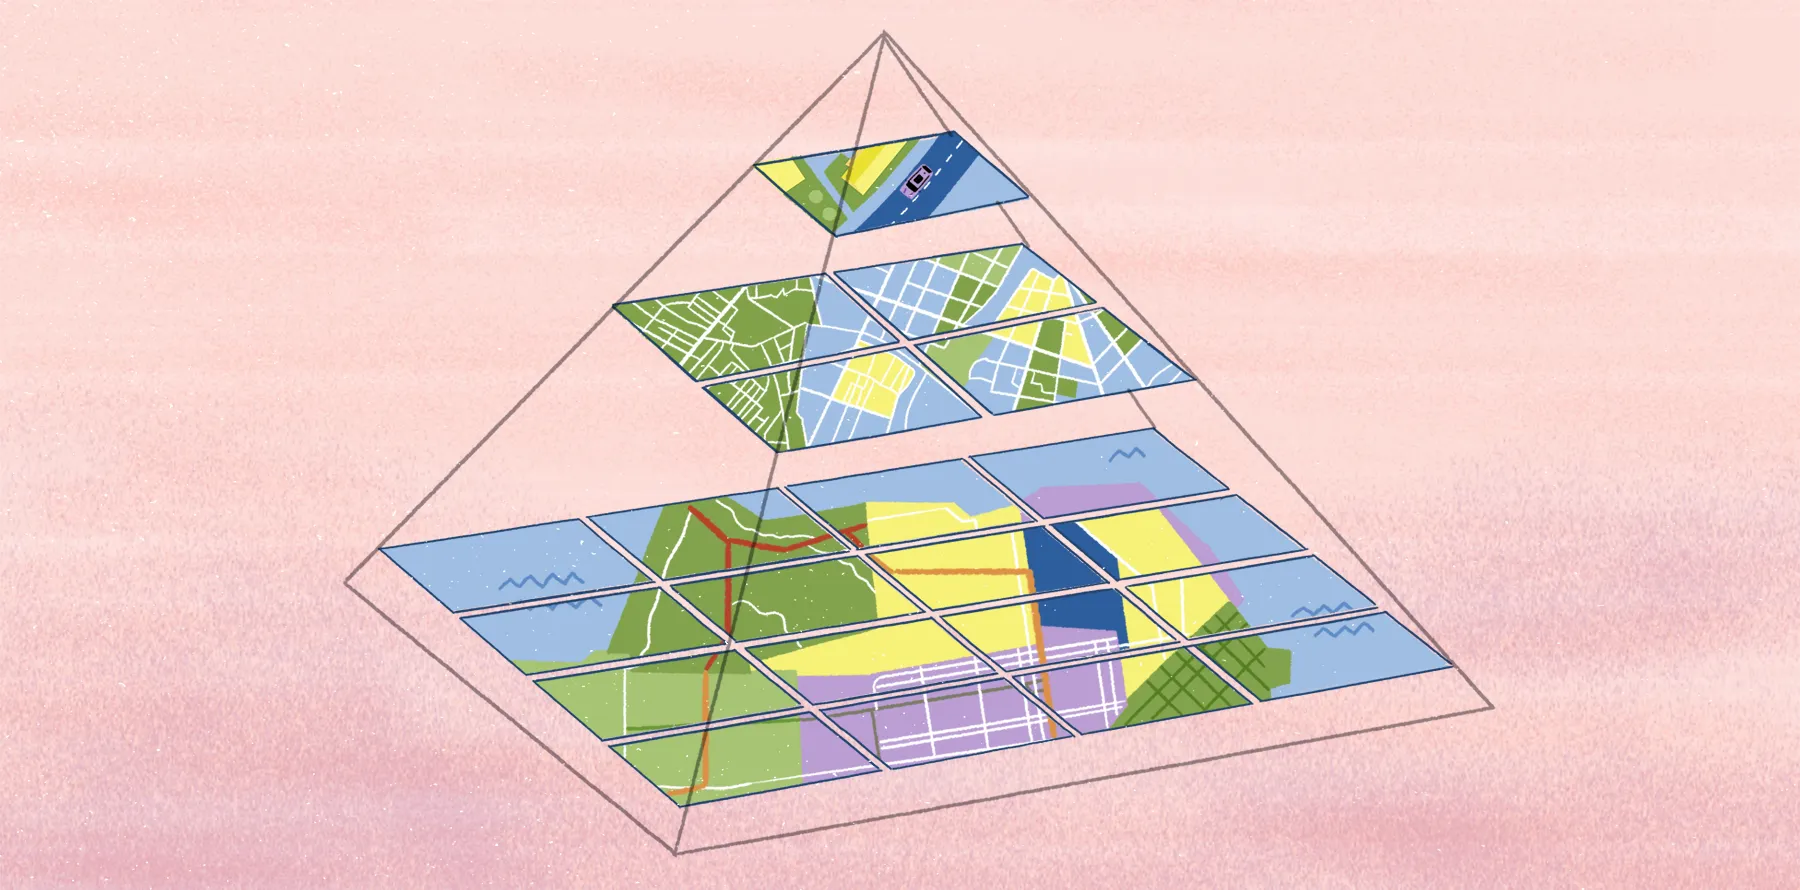
- It simplifies complexity: GIS tools allow you to stack multiple data layers into a single view. For instance, this software lets you combine population density, sales performance, and transportation routes for a more comprehensive look at sales territories. As a result, overwhelming spreadsheets become easy-to-interpret visual dashboards.
These maps have nearly endless applications, and the people who use GIS are just as varied. Mapping tools empower urban planners to guide sustainable growth, scientists to monitor fragile ecosystems, and logistics experts to streamline global supply chains. For these teams, using GIS provides clarity and context, allowing them to act on geographical insights fueled by up-to-date data.
While teams have used GIS tools for years, modern cloud-based tools have made mapping and geospatial analysis even more accessible. Unlike legacy systems, flexible browser software lets businesses manage spatial data, collaborate, and share maps in real time — tasks that once took days or required specialized software.
Real-world applications of GIS
The uses of GIS span many industries and solve a range of spatial challenges. Here are a few applications of mapping software in everyday workflows.
Urban planning and smart cities
GIS software turns isolated spreadsheets and reports into a dynamic visual of infrastructure and land use. This gives city planners up-to-date insights for targeted development decisions and resource allocation. Here are a few ways these professionals use GIS:
- Zoning and land use: Planners combine land data with demographic trends to find the best locations for new housing, commercial development, and green space.
- Infrastructure and utilities: Teams analyze asset data to spot aging water pipes and strained power lines, helping them invest in upgrades before they become emergencies.
- Disaster preparedness: City teams map natural hazards, like flood zones and wildfire risks, to determine optimal evacuation routes and improve community safety.
- Traffic and mobility: Transportation agencies study congestion patterns and commuter behavior to optimize public transit while reducing gridlock.
These applications need multiple data sets from different sources and tight collaboration between teams and departments. Mapping platforms like Felt make it easy. Teams can layer zoning data, infrastructure networks, and environmental stats into a single interactive map. Then, they can share a simple link to invite teammates who can explore and edit the project.
In a few clicks, teams can analyze the data with tools like Buffer and Intersect. This allows for granular exploration, from identifying specific locations within a feature’s radius to defining overlapping data layers.
Transportation and logistics optimization
GIS tools help logistics teams analyze routes and road conditions. Companies use spatial analysis to map out different scenarios and adjust their operations based on weather, road closures, and new delivery expectations. Here are a few examples:
- Route planning: Transportation companies find the most efficient routes by factoring in distance and traffic patterns.
- Fleet optimization: Fleet management teams track vehicles to make sure drivers minimize fuel consumption, choose the best routes, and reduce idle time.
- Delivery networks: Teams optimize supply chains by mapping locations for warehouses and distribution centers, factoring in data like distance and proximity to high-density areas.
- Traffic analysis: Agencies study traffic flows to reduce road congestion for personal vehicles and commercial fleets.
Environmental monitoring and climate research
GIS gives environmental teams a bird’s-eye view of the planet, tracking both sudden events and long-term trends. By pairing satellite imagery with climate and terrain data, GIS reveals environmental relationships invisible at ground level. Here’s how it works:
- Monitoring air quality: Environmentalists map air quality to identify pollution hotspots with elevated levels of smog or particulate matter.
- Tracking deforestation: Teams use satellite imagery to track forest loss and flag areas at risk from logging and agricultural expansion.
- Analyzing climate trends: Scientists layer temperature, precipitation, and sea-level data to visualize the effects of climate change.
- Protecting habitats: Biologists map animal movements and migration patterns to design safer corridors for vulnerable wildlife.
Environmental data sets often include large raster data sets — like elevation models and climate layers — that are difficult to share and visualize. Felt lets researchers easily upload raster data, processing massive sets of information in moments.
Agriculture and land management
GIS mapping reveals subtle differences in soil, moisture, and crop health from acre to acre. This data flows directly into digital farm management tools, helping agricultural teams manage land more efficiently and optimize yields throughout the year. Here’s how it works in practice:
- Crop health monitoring: Farmers use satellite imagery and remote sensing to detect stressed plants early and address problems before they worsen.
- Soil analysis: Agronomists map soil nutrients and composition to apply fertilizer only where it’s needed, saving money and reducing waste.
- Irrigation planning: Teams measure soil moisture levels to target dry spots and avoid overwatering other areas of the field.
- Yield forecasting: Land managers analyze historical and live geographic data to predict harvests and organize supply chain logistics.
Public health and emergency response
GIS software transforms complex data into shareable maps that guide public health campaigns and emergency response. Whether planning ahead or responding in real time, mapping the geography of an event and its effects makes a significant difference in keeping people safe. Here’s how health teams use GIS:
- Tracking diseases: Health agencies map reported cases of infectious diseases to identify hotspots and stop outbreaks faster.
- Allocating resources: Dispatch teams use real-time event location data to decide where to send staff and emergency equipment and which routes to take.
- Planning for emergencies: Agencies map evacuation routes and safe shelters to help communities prepare for emergencies.
- Coordinating live response: Search and rescue teams share interactive maps to synchronize response efforts across affected neighborhoods.
Emergency teams use tools like Felt to map situations as they unfold. Felt’s Field App lets ground teams quickly collect data, like damaged infrastructure or blocked roads, and sync it with office systems. This provides instant access to real-world information and allows faster life-saving decisions.
Challenges and limitations of GIS
GIS software is essential to modern businesses, but it has its share of hurdles. Here are a few potential challenges teams face:
- High costs: Traditional GIS software is expensive, particularly at the enterprise level, where organizations need several licenses and in-person installation and maintenance.
- Specialized expertise: Many tools depend on technical knowledge, restricting use to trained GIS specialists. These systems often require coding experience, mapping expertise, and IT skills.
- Complex workflows: In complex systems, integrating spatial data from multiple sources takes careful setup to clean and standardize information.
- Large data sets: Geospatial data is heavy to work with and may require substantial storage and processing times.
Luckily, cloud-based GIS tools dramatically eliminate obstacles. Platforms like Felt sidestep complex data integration and long processing times — simply upload any file and transform it into an interactive map. It’s accessible and requires little technical expertise, allowing every team member to jump in via link, review data, and leave comments.
See how teams use Felt for real-world GIS projects
GIS tools are everywhere for a reason. They’ve helped teams across industries analyze spatial patterns and understand real-life events for decades. But the way we work with geospatial data is much different than it used to be. No more static maps and legacy systems — modern mapping tools turn geospatial data sets into interactive, shareable maps that update in real time.
Felt lets teams create engaging maps right in their browser. Upload any data, visualize and layer it, and share the project in moments. Multiple teammates can jump in for collaborative sessions, editing data in real time to reflect changing conditions and adjust plans on the fly.
While it offers advanced insights, Felt keeps things simple. Its intuitive interface and features help teams move quickly from raw data to actionable insights. Whether you’re a GIS specialist, engineer, or non-technical teammate, you can contribute to mapping projects without the hassle.
Check out Felt’s map gallery to see how different teams use maps to analyze data and tackle challenges in the field.
Compare Felt using AI