
What’s trade area analysis? Revealing untapped business opportunities
When companies expand into new markets, it’s difficult to confidently make spatial decisions based on instinct and spreadsheet data. Trade area analysis lets analysts and engineers move forward with clarity. It informs each choice by revealing where demand, competition, and customer habits suggest real potential.
In this guide, you’ll learn what trade area analysis is, why it enhances real-world decisions, and how to determine a zone with real business opportunities.
What’s a trade area?
A trade area is the geographic zone where a business attracts most of its customers. Essentially, it reflects how far customers are willing to travel for goods and services. For example, a neighborhood retail store might draw most of its shoppers within a short drive or walking distance, with smaller pockets of demand branching farther out. If you map the most common customer locations, visits, and order destinations, these clusters start to form a clear boundary of influence.
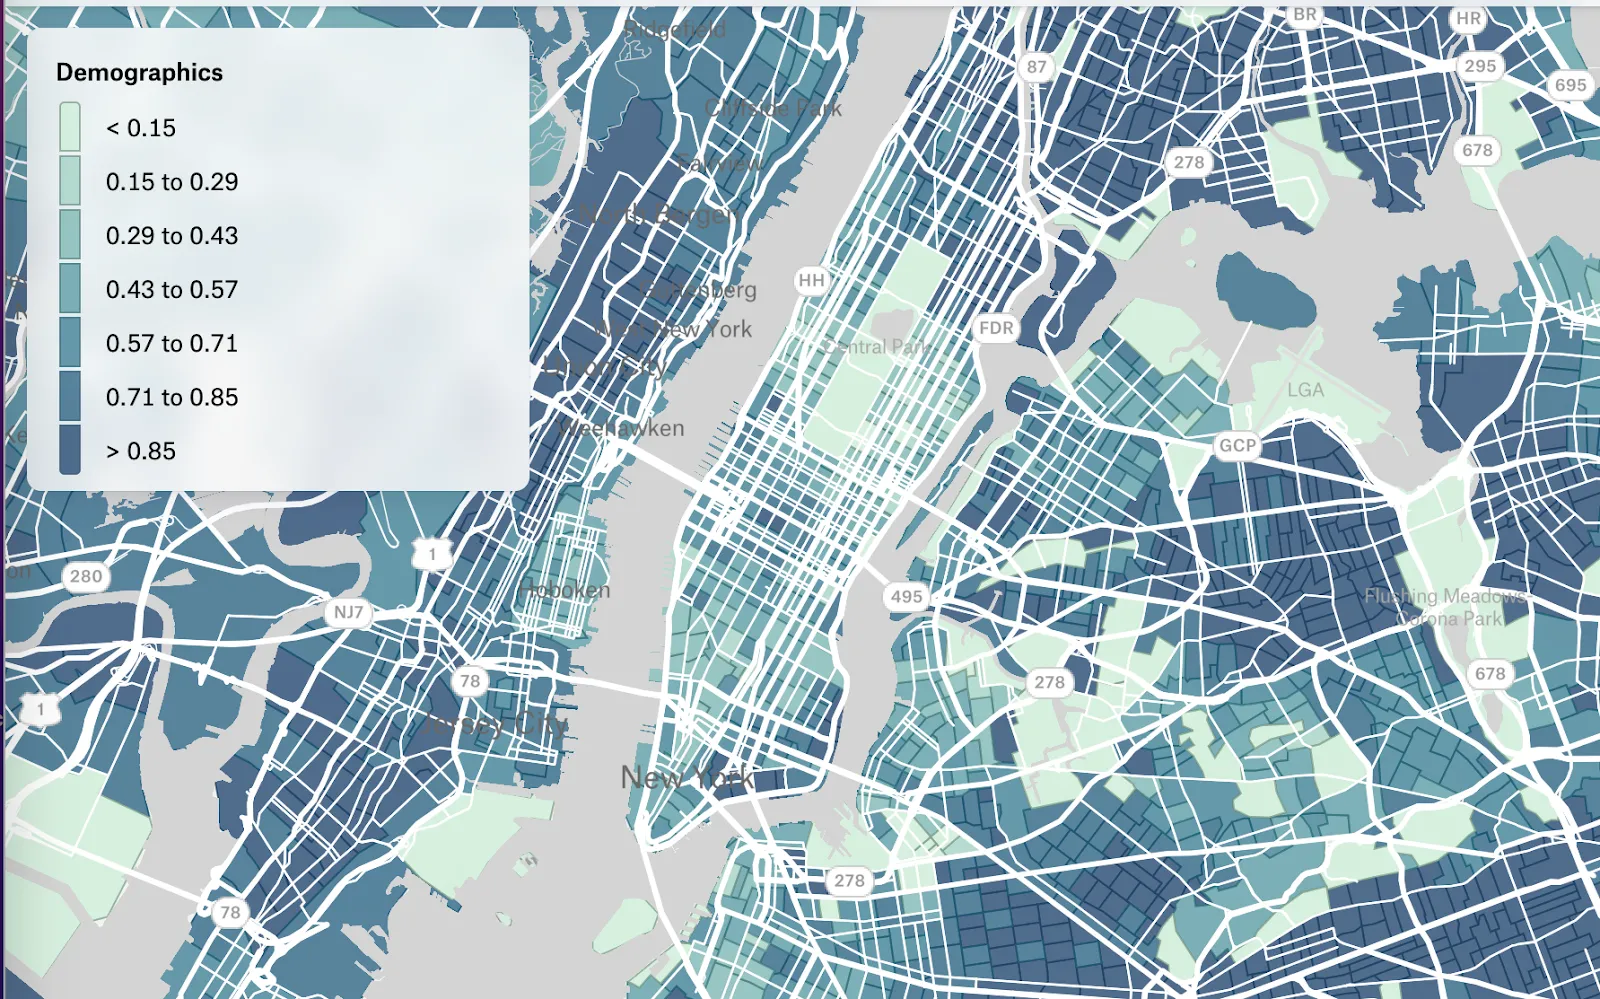
Defining a trade area on an interactive map — like the one below — lets you see metrics like population density and consumer patterns at a glance. This means you can study shifting trends in established locations and confidently plan new, successful trade areas in the future.
Trade areas vs. market areas: Definition and difference
These two terms are often used interchangeably, but there’s a difference. A trade area is typically more specific and behavior driven, reflecting where consumers actually come from. On the other hand, a market area is broader and more about potential.
For instance, most of a neighborhood coffee shop’s customers might live or work within a 5–7 minute walk — that’s its trade area. It’s a zone where your customers reside.
However, a market area might refer to a broad area with a high demand for coffee that spans several districts. Even if your store doesn’t currently attract people from those districts, the area still represents a market where coffee shops compete and future locations could succeed.
What’s trade area analysis?
Trade area analysis is the process of studying the geographic zone that contributes to the majority of a company’s activity. This analysis uncovers what happens in this zone and how it’s relevant to your business. It examines factors like:
- Customer distribution: Where your consumers are concentrated and how far they’re willing to travel to interact with your product or service
- Accessibility and proximity: How easy it is to reach your location by foot, vehicle, and public transit
- Competition: Which other businesses are nearby and how they overlap with your offerings
- Neighborhood characteristics: Local trade area demographics, land use, and activity patterns that influence demand
For example, a bank branch might show strong account openings from one corridor but low activity from an adjacent, rapidly growing suburb. In this case, an analysis would reveal insights that help teams take action — like deploying more ATMs or exploring new branch locations — and boost their impact in that region.
The benefits of a trade area analysis
Understanding your trade area gives you a better picture of real opportunities. When you know which neighborhoods contribute to your business — and which ones could — you can make informed decisions about expanding and allocating resources.
Here are some benefits of conducting a trade analysis:
- Identify high-potential locations: Teams can highlight targeted geographic areas where demand, demographics, and accessibility align so they know where to invest next.
- Improve performance: Companies can examine different trading areas to reveal which ones excel and which underperform. This data lets them keep processes steady in successful areas and tweak what isn’t working.
- Understand consumer behavior: Teams analyze trade areas to visualize how far customers travel, which routes they take, and what factors influence their visits. These insights inform future planning, development, and campaigns.
- Measure competitive pressure: Thorough analysis shows where competitors overlap in the area so they can find opportunities and gaps in the market.
- Predict growth more accurately: Analysis lets teams combine spatial patterns with business metrics. This allows them to model how new locations might perform using real historical data before committing.
A trade area analysis example: How to determine your ideal zone
A good opportunity isn’t automatically visible on a map — it typically emerges after layering relevant data, asking the right questions, and ruling out weaker options. Here’s a quick blueprint you can use to analyze trade areas.
1. Pick a market area
First, choose the broader market area you want to study. This is the city, corridor, or region where you feel there’s enough demand to justify a deeper look. Then, define your narrower trade zone — don’t wait too long for this step, as reviewing the market area in depth may keep your analysis too broad.
You might narrow your focus to three districts in a metro where population is rapidly growing and daytime foot traffic is high. Instead of trying to model the entire city, you pick one district as your starting point. Deciding which district can depend on simple factors like sales trends or new commercial developments.
After you have a defined area, you’ll have a clear boundary for the rest of your workflow. A geographic information system (GIS) like Felt can help here. Import your spatial data and instantly transform it into a dynamic, interactive map. This lets you see changes over time and the relationship between different data points with a few clicks.
2. Look at customer insights
Next, add consumer data so you can see where demand already comes from and what those customers look like. Go beyond the general population and dig into the behavior and characteristics of your ideal persona. Here are a few useful factors to consider:
- Transaction and visiting data: Where current orders, visits, and deliveries come from
- Customer profile signals: Attributes like household type, age range, and gender
- Behavior patterns: Time-of-day patterns and a mix of purchasing channels (in person, pickup, home delivery)
Visualize these insights with mapping software to quickly find trends and outliers around your existing locations. For example, a restaurant business might see strong lunchtime demand from office-heavy blocks and weaker sales from nearby residential areas. Patterns like this are early cues to optimize current and future sites.
3. Find patterns in local and global competitors
Discover which businesses also serve your potential customers. Competitors come in two types:
- Local competitors: Other store locations and sites inside your market area that directly overlap with your industry or business category
- Global competitors: Larger chains or brands with a strong presence in the wider area, even if they’re not as popular in your chosen region
On the map, you might notice that your small business is the only option of its kind near a busy transit stop, but several national chains dominate a nearby corridor. This pattern reveals two things: There’s a potential gap around the transit stop, and there may be intense competition if you extend your trade area too far into the corridor.
By comparing your existing customer base with competitor locations, you can see where you have the upper hand and where your competitors dominate. This lets you plan a new site that genuinely adds coverage instead of clashing with existing demand.
4. Consider geographic and demographic variables
Finally, add additional physical and human context to the trade area so your map’s boundaries become more realistic and useful. On the geographic side, consider travel patterns and connectors, which both show you how consumers reach your services. Travel patterns include metrics like drive times and public transit access, while connectors refer to features like highways and rail lines.
For demographic data, look at insights population, income, and time-based activity. This shows you if the local people have enough spending power to support your business, and which time of day they’re most active.
For example, you might have a high-income residential cluster sitting close to your site, but a highway and limited crossings mean they rarely visit. With a GIS like Felt, you can easily visualize those patterns and spot issues before you execute a project.
Determine your trade area successfully with Felt
Trade area analysis becomes far more effective when you can see your assumptions, data, and boundaries come together in a single interactive map. While spreadsheets convey this information, spatial visualization lets you understand how a project might perform in the real world.
Felt’s cloud-native GIS helps teams review changes, compare boundaries, and layer behavioral context directly in a browser-based map. Find your ideal trade area faster with real-time collaboration — team members can jump in and out for quick edits and helpful comments. Ready to share the results? Send a simple link to stakeholders they can dive into without installing software or creating logins.
Discover untapped markets confidently with Felt.
Compare Felt using AI


.jpg)