Expanding into a new location or introducing a new product is meant to make your business stronger. The goal is more reach, more capacity — and most importantly — more revenue. But when expansions create overlap with existing operations, the result can be cannibalization that weakens performance. Demand shifts from nearby locations, and resources are spread thin without actually expanding the customer base.
In this guide, we’ll dive into how cannibalization analysis uses geospatial methods to evaluate risk before committing to a strategy. You’ll learn how teams model overlap, test expansion scenarios, and compare outcomes to understand whether a new service area or retail location adds net value.
We’ll also show how you can map out scenarios in Felt to pressure-test decisions before making moves.
What cannibalization analysis is and why it matters
In business, cannibalization occurs when a company’s own products, services, or locations compete for the same customer base. Sometimes described as “internal cannibalization” or “business cannibalism,” it occurs when expansion pulls demand away from existing offerings. On paper, activity might increase, but profitability often stays flat or even declines.
What does cannibalization do to your business?
Cannibalization is expensive. When a business cannibalizes its own network, it spreads operational costs across more touchpoints without growing revenue margins. It also reduces the impact of marketing strategies that should support growth. Rather than strengthening the brand against a competitor with a new product line or retail location, internal competition fragments sales and weakens performance.
Where does cannibalization analysis fit in?
Cannibalization analysis is the method organizations use to assess negative outcomes. It helps teams look past individual performance and evaluate how changes impact the entire business.
Cannibalization analysis can be reactive or predictive. Reactive studies measure the impact of a new location or service area on existing performance. Predictive studies model future scenarios like potential expansions to help avoid cannibalizing existing operations.
Cannibalization analysis relies on a few spatial concepts that illustrate how consumers move and make decisions, including:
- Catchment areas: Also known as a trade zone, a catchment area is the geographic area a business serves. It’s shaped by distance, travel time, and accessibility and illustrates where consumers come from.
- Network overlap: Overlap happens when multiple locations serve the same catchment area. It signals the business competes with itself for the same consumer base. Gaps, on the other hand, identify expansion opportunities.
- Customer flow: This describes how customers move through your business, from initial interaction to final purchase. It shows how people choose between locations, services, or product lines. Customer flow helps teams understand consumer behavior and whether expansion will optimize their experience or create friction that leads to cannibalization.
For instance, imagine a retailer opens a second store a few blocks away from another location. Cannibalization analysis examines how customer traffic and sales change across both stores’ shared catchment area.
If the new store fills up while the original slows down, the data shows the expansion is cannibalizing demand rather than growing it. The retailer may consider relocating the new store to another underserved catchment area or differentiating stores through product mix or marketing strategy.
How to conduct cannibalization analysis step by step
Cannibalization analysis follows a clear sequence. These steps outline a practical way to evaluate how changes affect demand across your business’s network.
1. Prepare data and define trade areas
Identify the locations you want to evaluate, including existing stores and any proposed retail locations. Each location should have a clear geographic point and at least one performance metric, such as sales or visits. This gives you a baseline for comparing how demand differs across locations.
Next, focus on how customers decide where to go. For retailers, this is often distance or how easy it is to reach a store on foot, by car, or by public transport. Use that understanding to define trade areas that show where customers are likely coming from.
Define a realistic trade area based on how far your customers travel, and use demographic data to model potential consumer demand. Be flexible with your data — consumers in a dense urban area behave differently than consumers in rural zones, and your projected trade areas should reflect that.
2. Model overlap
Now it’s time for spatial analysis. With your trade areas drawn on a map, identify where they intersect. Focus on how much of a new location’s coverage overlaps existing ones and how much demand sits inside that shared space. This step estimates where a new site attracts new customers or cannibalizes sales from nearby locations.
3. Interpret results and identify opportunities
Compare gains and losses across your business network. High overlap signals cannibalization, while low overlap points to strong expansion opportunities. Use those patterns to identify gaps in coverage and areas where new product lines can grow revenue.
When to use cannibalization analysis in real planning
When considering a new store location or service zone, cannibalization analysis helps predict how changes will ripple across your network. The following scenarios show where this method adds the most value:
- Rapid retail expansion: Opening multiple stores in a short time frame can split demand. Cannibalization analysis identifies whether projected sales are likely to come from new customers or pulled from within the same networks, helping you choose the right real estate for your business.
- Warehouse network optimization: When a company adds or relocates a warehouse, the goal is more efficient deliveries and expanded coverage. Cannibalization analysis shows whether innovation captures new demand or just reroutes delivery volume away from other facilities.
- Franchise territory design: When franchise territories sit too close together, operators end up competing for the same consumer base. Competition lowers sales and depletes overall value of the franchise. Cannibalization analysis highlights where catchment areas overlap so franchise owners can protect revenue and reduce competition.
- Hospital or clinic access planning: New healthcare services should make care easier to access. Cannibalization analysis shows healthcare providers how patient demand may be redistributed across nearby facilities and help serve existing patients or underserved new patients.
Cannibalization analysis only works when you understand how your consumers behave. If your demographic data or demand signals are slim or outdated, the results won’t be reliable.
Likewise, cannibalization analysis doesn’t answer all the questions. Teams should use cannibalization analysis alongside other methods, such as market research, competitor analysis, and pricing strategy.
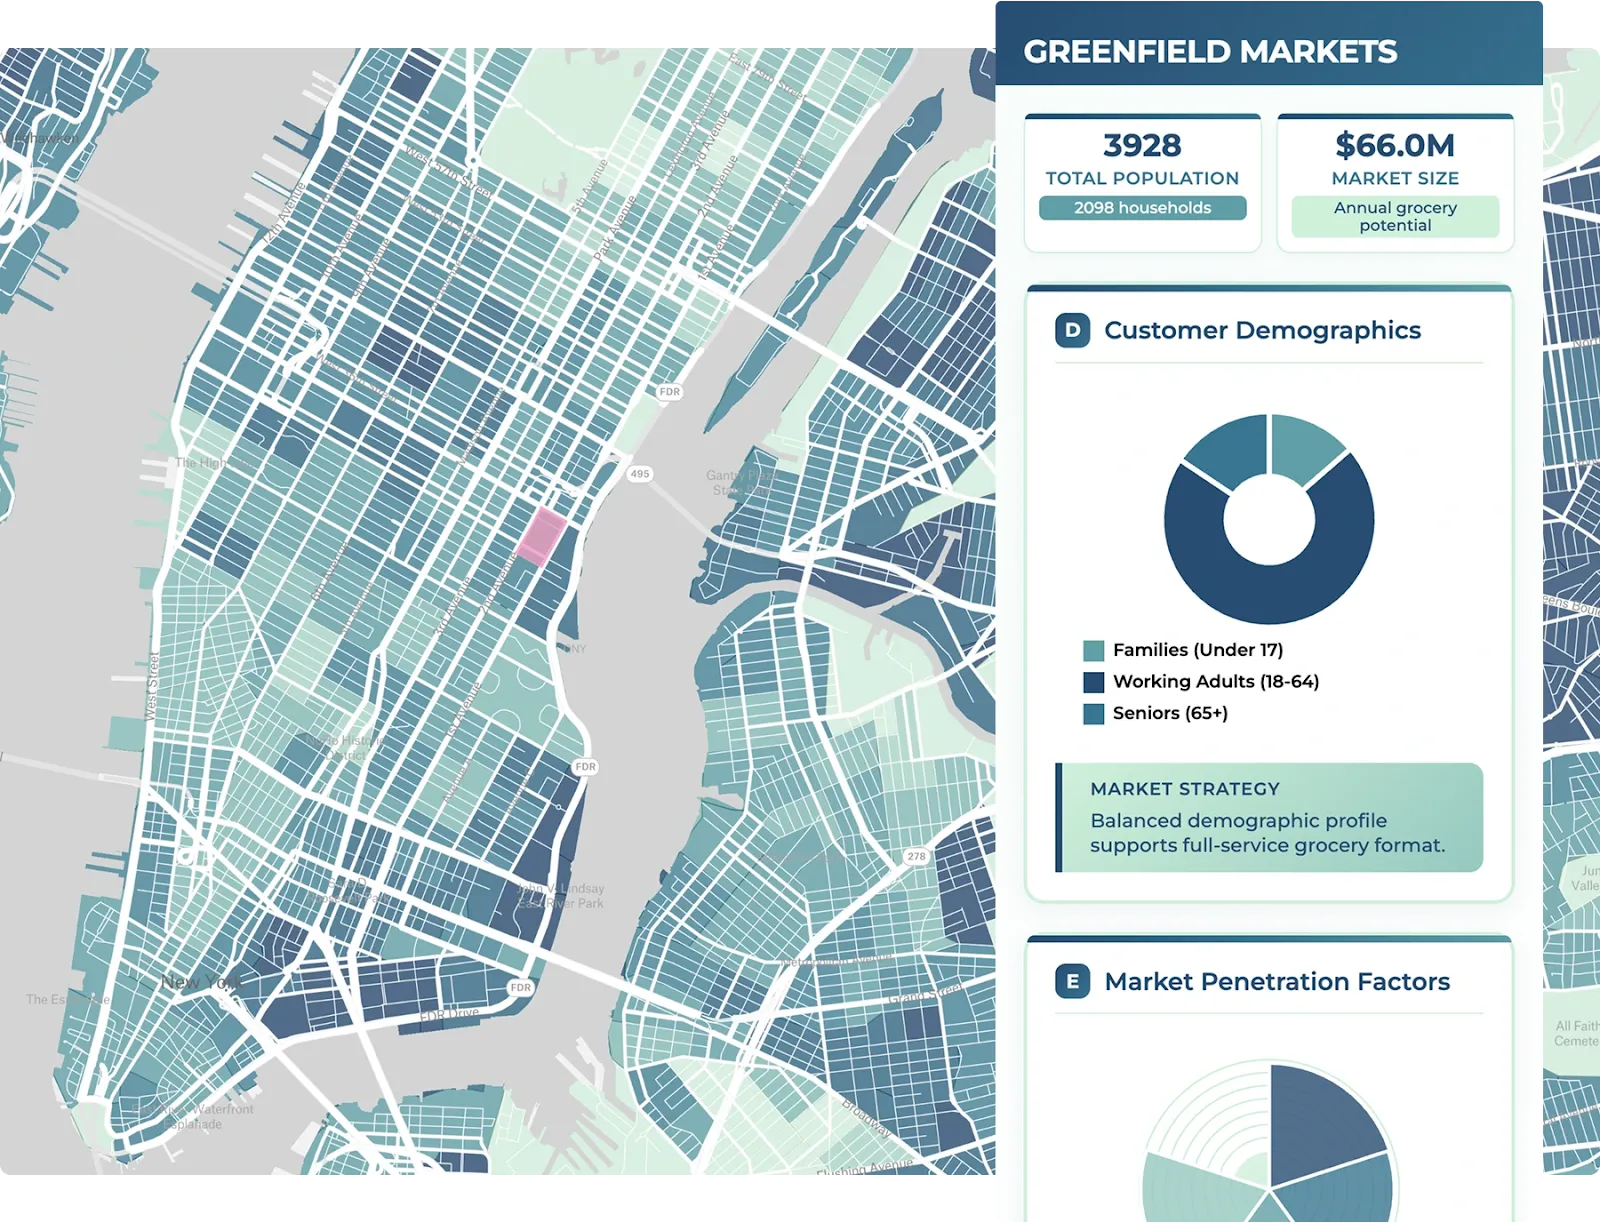
See how teams use Felt to visualize and share cannibalization insights
Cannibalization analysis and maps go hand in hand. Trade areas, coverage overlap, and customer movement represent spatial patterns, and they only become clear when they’re mapped together.
Felt empowers teams to draw and compare catchment areas, model trade zone overlap, and layer sales or demographic data on top — in a single, shared platform. Cannibalization analysis rarely lives with one person: real estate, finance, and operations all need to weigh in on the same data. Felt lets all those stakeholders work from the same live map, so teams can align on assumptions together rather than passing static exports back and forth.
This supports better decisions and reduces the risk of cannibalizing the network. And because Felt connects directly to cloud databases like Snowflake, BigQuery, and Postgres, teams can keep their sales and location data in their current systems and surface it on the map. This reduces manual exports and file handoffs that lead to outdated analysis.
See how your team can map trade areas and model overlap in Felt. Book a demo or start a free trial today.
FAQ
How is cannibalization analysis different from simple market overlap?
Market overlap refers to two or more businesses that target the same customer base. Cannibalization involves a single business competing with itself. It looks at how new locations, services, or products pull demand from existing ones, rather than how competitors overlap in the same market. For businesses planning expansion, using both studies together creates a fuller picture of potential market expansion.
How can the cannibalization rate be calculated?
Teams typically calculate demand within overlapping trade areas. They estimate what share of that demand shifts internally versus what appears to be activity from new consumers.
Can cannibalization analysis help identify ideal expansion zones?
Yes. By showing where demand is already well served and where gaps exist, cannibalization analysis helps teams identify expansion opportunities. These areas are more likely to grow the customer base instead of split existing activity.
Compare Felt using AI


.jpg)